Philips 2012 Annual Report Download - page 217
Download and view the complete annual report
Please find page 217 of the 2012 Philips annual report below. You can navigate through the pages in the report by either clicking on the pages listed below, or by using the keyword search tool below to find specific information within the annual report.-
 1
1 -
2
-
3
-
4
-
5
-
6
-
7
-
8
-
9
-
10
-
11
-
12
-
13
-
14
-
15
-
16
-
17
-
18
-
19
-
20
-
21
-
22
-
23
-
24
-
25
-
26
-
27
-
28
-
29
-
30
-
31
-
32
-
33
-
34
-
35
-
36
-
37
-
38
-
39
-
40
-
41
-
42
-
43
-
44
-
45
-
46
-
47
-
48
-
49
-
50
-
51
-
52
-
53
-
54
-
55
-
56
-
57
-
58
-
59
-
60
-
61
-
62
-
63
-
64
-
65
-
66
-
67
-
68
-
69
-
70
-
71
-
72
-
73
-
74
-
75
-
76
-
77
-
78
-
79
-
80
-
81
-
82
-
83
-
84
-
85
-
86
-
87
-
88
-
89
-
90
-
91
-
92
-
93
-
94
-
95
-
96
-
97
-
98
-
99
-
100
-
101
-
102
-
103
-
104
-
105
-
106
-
107
-
108
-
109
-
110
-
111
-
112
-
113
-
114
-
115
-
116
-
117
-
118
-
119
-
120
-
121
-
122
-
123
-
124
-
125
-
126
-
127
-
128
-
129
-
130
-
131
-
132
-
133
-
134
-
135
-
136
-
137
-
138
-
139
-
140
-
141
-
142
-
143
-
144
-
145
-
146
-
147
-
148
-
149
-
150
-
151
-
152
-
153
-
154
-
155
-
156
-
157
-
158
-
159
-
160
-
161
-
162
-
163
-
164
-
165
-
166
-
167
-
168
-
169
-
170
-
171
-
172
-
173
-
174
-
175
-
176
-
177
-
178
-
179
-
180
-
181
-
182
-
183
-
184
-
185
-
186
-
187
-
188
-
189
-
190
-
191
-
192
-
193
-
194
-
195
-
196
-
197
-
198
-
199
-
200
-
201
-
202
-
203
-
204
-
205
-
206
-
 207
207 -
 208
208 -
 209
209 -
 210
210 -
 211
211 -
 212
212 -
 213
213 -
 214
214 -
 215
215 -
 216
216 -
 217
217 -
 218
218 -
 219
219 -
 220
220 -
 221
221 -
 222
222 -
 223
223 -
 224
224 -
 225
225 -
 226
226 -
 227
227 -
228
-
229
-
230
-
231
 |
 |

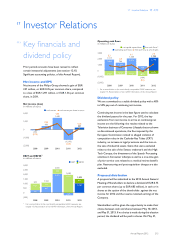
17 Investor Relations 17.1 - 17.2
Annual Report 2012 217
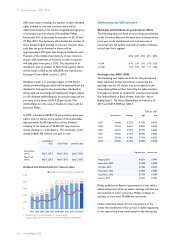
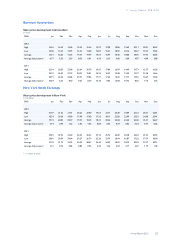
on December 31, 2012 (USD 1 = EUR 0.7582). This rate is
not materially different from the Noon Buying Rate on
such date (USD 1 = EUR 0.7584).
The following table sets out the exchange rate for US
dollars into euros applicable for translation of Philips’
financial statements for the periods specified.
EUR per USD
period end average high low
2007 0.6790 0.7272 0.7694 0.6756
2008 0.7096 0.6832 0.7740 0.6355
2009 0.6945 0.7170 0.7853 0.6634
2010 0.7485 0.7540 0.8188 0.7036
2011 0.7728 0.7192 0.7728 0.6721
2012 0.7582 0.7776 0.8166 0.7500
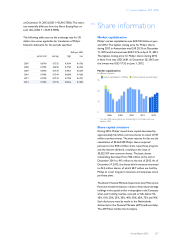
17.2 Share information
Market capitalization
Philips’ market capitalization was EUR 18.2 billion at year-
end 2012. The highest closing price for Philips’ shares
during 2012 in Amsterdam was EUR 20.33 on December
11, 2012 and the lowest was EUR 13.76 on April 11, 2012.
The highest closing price for Philips’ shares during 2012
in New York was USD 26.81 on December 20, 2012 and
the lowest was USD 17.32 on June 1, 2012.
Market capitalization
in billions of euros
■
■-market capitalization of Philips--■-of which publicly quoted stakes1)
30
20
10
0
2008 2009 2010 2011 2012
1) The year 2008 mainly reflects our shareholding in LG Display which was
exited in 2009
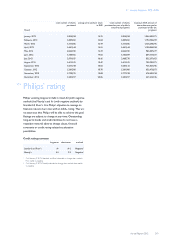
Share capital structure
During 2012, Philips’ issued share capital decreased by
approximately 52 million common shares to a level of 957
million common shares. The main reasons for this are the
cancellation of 82,364,590 Philips shares acquired
persuant to the EUR 2 billion share repurchase program
and the elective dividend, resulting in the issue of
30,522,107 new common shares. The basic shares
outstanding decreased from 926 million at the end of
December 2011 to 915 million at the end of 2012. As of
December 31, 2012, the shares held in treasury amounted
to 42.5 million shares, of which 28.7 million are held by
Philips to cover long-term incentive and employee stock
purchase plans.
The Dutch Financial Markets Supervision Act (Wet op het
financieel toezicht) imposes a duty to disclose percentage
holdings in the capital and/or voting rights in the Company
when such holding reaches, exceeds or falls below 5%,
10%, 15%, 20%, 25%, 30%, 40%, 50%, 60%, 75% and 95%.
Such disclosure must be made to the Netherlands
Authority for the Financial Markets (AFM) without delay.
The AFM then notifies the Company.