Philips 2012 Annual Report Download - page 190
Download and view the complete annual report
Please find page 190 of the 2012 Philips annual report below. You can navigate through the pages in the report by either clicking on the pages listed below, or by using the keyword search tool below to find specific information within the annual report.-
 1
1 -
2
-
3
-
4
-
5
-
6
-
7
-
8
-
9
-
10
-
11
-
12
-
13
-
14
-
15
-
16
-
17
-
18
-
19
-
20
-
21
-
22
-
23
-
24
-
25
-
26
-
27
-
28
-
29
-
30
-
31
-
32
-
33
-
34
-
35
-
36
-
37
-
38
-
39
-
40
-
41
-
42
-
43
-
44
-
45
-
46
-
47
-
48
-
49
-
50
-
51
-
52
-
53
-
54
-
55
-
56
-
57
-
58
-
59
-
60
-
61
-
62
-
63
-
64
-
65
-
66
-
67
-
68
-
69
-
70
-
71
-
72
-
73
-
74
-
75
-
76
-
77
-
78
-
79
-
80
-
81
-
82
-
83
-
84
-
85
-
86
-
87
-
88
-
89
-
90
-
91
-
92
-
93
-
94
-
95
-
96
-
97
-
98
-
99
-
100
-
101
-
102
-
103
-
104
-
105
-
106
-
107
-
108
-
109
-
110
-
111
-
112
-
113
-
114
-
115
-
116
-
117
-
118
-
119
-
120
-
121
-
122
-
123
-
124
-
125
-
126
-
127
-
128
-
129
-
130
-
131
-
132
-
133
-
134
-
135
-
136
-
137
-
138
-
139
-
140
-
141
-
142
-
143
-
144
-
145
-
146
-
147
-
148
-
149
-
150
-
151
-
152
-
153
-
154
-
155
-
156
-
157
-
158
-
159
-
160
-
161
-
162
-
163
-
164
-
165
-
166
-
167
-
168
-
169
-
170
-
171
-
172
-
173
-
174
-
175
-
176
-
177
-
178
-
179
-
 180
180 -
 181
181 -
 182
182 -
 183
183 -
 184
184 -
 185
185 -
 186
186 -
 187
187 -
 188
188 -
 189
189 -
 190
190 -
 191
191 -
 192
192 -
 193
193 -
 194
194 -
 195
195 -
 196
196 -
 197
197 -
 198
198 -
 199
199 -
 200
200 -
201
-
202
-
203
-
204
-
205
-
206
-
207
-
208
-
209
-
210
-
211
-
212
-
213
-
214
-
215
-
216
-
217
-
218
-
219
-
220
-
221
-
222
-
223
-
224
-
225
-
226
-
227
-
228
-
229
-
230
-
231
 |
 |

14 Sustainability statements 14 - 14.1
190 Annual Report 2012
Green Innovation
Green Innovation comprise all R&D activities directly contributing to
the development of Green Products or Green Technologies. A wide
set of additional criteria and boundaries have been defined as the basis
for internal and external validation.
Environmental data
All environmental data from manufacturing operations are reported on
a half-year basis in our sustainability reporting and validation tool,
according to defined company guidelines that include definitions,
procedures and calculation methods.
Internal validation processes are followed and audits performed to
ensure consistent data quality and to assess the robustness of data
reporting systems.
These environmental data from manufacturing are tracked and
reported to measure progress against our Green operations program
targets.
Reporting on ISO 14001 certification is based on manufacturing units
reporting in the sustainability reporting system.
Operational carbon footprint
The Philips operational carbon footprint is calculated on a half-yearly
basis and includes:
• Industrial sites – manufacturing and assembly sites
• Non-industrial sites – offices, warehouses, IT centers and R&D
facilities
• Business travel – lease and rental cars and airplane travel
• Logistics – air, sea and road transport
All emission factors used to transform input data (for example, amount
of tonne-kilometers transported) into CO2 emissions are from the
Greenhouse Gas Protocol (GHGP), except for business travel, where
the service providers supplied CO2 data based on their own verified
methodology. The GHGP distinguishes three scopes. It is mandatory
to report on the first two to comply with the GHGP reporting
standards.
• Scope 1 – direct CO2 emissions – is reported on with direct
emissions from our industrial and non-industrial sites in full.
Emissions from industrial sites, which consist of direct emissions
resulting from processes and fossil fuel combustion on site, are
reported in the sustainability reporting system. Energy use and CO2
emissions from non-industrial sites are based on actual data where
available. If this is not the case, they are estimated based on square
meters, taking the geographical location and building type of the site
into account.
• Scope 2 – CO2 emissions resulting from the generation of purchased
electricity for our premises – is reported on with electricity use from
industrial and non-industrial sites in full. Indirect CO2 emissions
resulting from purchased electricity, steam and heat are reported in
the sustainability reporting system. Those emissions of industrial
sites not yet reporting are calculated on the same basis as described
in Scope 1. Indirect emissions of non-industrial sites are calculated
in the same manner as described in Scope 1.
• Scope 3 – other CO2 emissions related to activities not owned or
controlled by the Group is reported on for our business travel and
distribution activities. Commuting by our employees, upstream
distribution (before suppliers ship to us), outsourced activities and
emissions resulting from product use by our customers are not
included in our operational carbon footprint. The calculations for
business travel by lease cars are based on actual fuel usage and for
rental cars on distance traveled. Emissions from business travel by
airplane are calculated by the supplier based on mileage flown and
emission factors from DEFRA (UK Department of Environment,
Food and Rural Affairs), distinguishing between short, medium and
long flights. Further, emissions from air freight for distribution are
calculated based on the amount of tonne-kilometers transported
between airports (distinguishing between short, medium and long
hauls), including an estimate (based on actual data of the lanes with
the largest volumes) for trucking from sites and distribution centers
to airports and vice versa. Express shipments are generally a mix of
road and air transport, depending on the distance. Therefore the
assumption is applied that shipments over less than 600 km are
transported by road and the rest of the shipments by air (those
emissions by air are calculated in the same way as air freight). For
sea transport, only data on transported volume were available so an
estimate had to be made about the average weight of a container.
Transportation to and from ports is not registered. This fore and aft
part of sea transport was estimated to be around 3% of the total
distance (based on actual data of the lanes with the largest volumes),
consisting of a mix of modalities, and was added to the total
emissions accordingly. CO2 emissions from road transport were also
calculated based on tonne-kilometers. If data were incomplete, the
emissions were estimated based on sales volumes. Return travel of
vehicles is not included in the data for sea and road distribution.
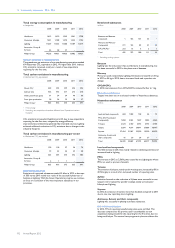
Health and safety
Health and safety data are reported and validated monthly. The focus
is on reporting work-related injuries, which predominantly occur in
manufacturing operations. The annual number of cases leading to at
least one lost workday is reported per 100 FTEs (full-time equivalents).
Fatalities are reported for staff, contractors and visitors and include
commuting accidents.
General Business Principles
Alleged GBP violations are registered in our intranet-based reporting
and validation tool.
Supplier audits
Supplier audits are primarily focused on identified risk suppliers, based
on identified risk countries and on spend of more than EUR 1 million
(new suppliers EUR 100,000 and no threshold for high risk suppliers).
• Based on the Maplecroft Human Rights Risk Indexes, risk countries
for Supply Management in 2012 were: Belarus, Brazil, China,
Dominican Republic, India, Indonesia, Mexico, the Philippines, Russia,
and Ukraine.
• Suppliers of new ventures are included to the extent that the
integration process of these ventures has been finalized. Normative
integration period is two years after closure of the new venture.
Sustainability governance
Sustainability is strongly embedded in our core business processes, like
innovation (EcoDesign), sourcing (Supplier Sustainability Involvement
Program), manufacturing (Green Manufacturing 2015) and Logistics
(Green Logistics).
The Sustainability Board is the highest governing sustainability body in
Philips, chaired by Jim Andrew, member of the Executive Committee.
Three other Executive Committee members sit in the Sustainability
Board jointly with sector and functional executives. The Sustainability
Board convenes four times per year, defines Philips’ sustainability
strategy and programs, monitors progress and takes corrective action
where needed.
External assurance
KPMG has provided reasonable assurance on whether the information
in chapter 14, Sustainability statements, of this Annual Report including
the information referred to in section 5.2, Social performance, of this
Annual Report and section 5.3, Environmental performance, of this
Annual Report is, in all material respects, fairly presented in accordance
with the reporting criteria. We refer to section 14.6, Independent
assurance report, of this Annual Report.
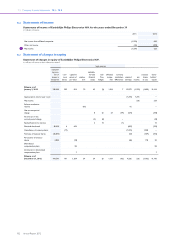
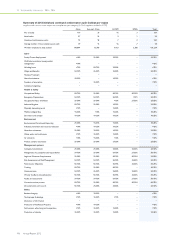
14.1 Economic indicators
This section provides summarized information on contributions on an
accruals basis to the most important economic stakeholders as a basis
to drive economic growth. For a full understanding of each of these
indicators, see the specific financial statements and notes in this report.
Distribution of direct economic benefits
in millions of euros
2010 2011 2012
Suppliers: goods and services 13,265 13,845 15,379
Employees: salaries and wages 5,035 5,123 5,974
Shareholders: distribution from retained
earnings 650 711 687
Government: corporate income taxes 497 283 308
Capital providers: net interest 225 210 241