Philips 2012 Annual Report Download - page 196
Download and view the complete annual report
Please find page 196 of the 2012 Philips annual report below. You can navigate through the pages in the report by either clicking on the pages listed below, or by using the keyword search tool below to find specific information within the annual report.-
 1
1 -
2
-
3
-
4
-
5
-
6
-
7
-
8
-
9
-
10
-
11
-
12
-
13
-
14
-
15
-
16
-
17
-
18
-
19
-
20
-
21
-
22
-
23
-
24
-
25
-
26
-
27
-
28
-
29
-
30
-
31
-
32
-
33
-
34
-
35
-
36
-
37
-
38
-
39
-
40
-
41
-
42
-
43
-
44
-
45
-
46
-
47
-
48
-
49
-
50
-
51
-
52
-
53
-
54
-
55
-
56
-
57
-
58
-
59
-
60
-
61
-
62
-
63
-
64
-
65
-
66
-
67
-
68
-
69
-
70
-
71
-
72
-
73
-
74
-
75
-
76
-
77
-
78
-
79
-
80
-
81
-
82
-
83
-
84
-
85
-
86
-
87
-
88
-
89
-
90
-
91
-
92
-
93
-
94
-
95
-
96
-
97
-
98
-
99
-
100
-
101
-
102
-
103
-
104
-
105
-
106
-
107
-
108
-
109
-
110
-
111
-
112
-
113
-
114
-
115
-
116
-
117
-
118
-
119
-
120
-
121
-
122
-
123
-
124
-
125
-
126
-
127
-
128
-
129
-
130
-
131
-
132
-
133
-
134
-
135
-
136
-
137
-
138
-
139
-
140
-
141
-
142
-
143
-
144
-
145
-
146
-
147
-
148
-
149
-
150
-
151
-
152
-
153
-
154
-
155
-
156
-
157
-
158
-
159
-
160
-
161
-
162
-
163
-
164
-
165
-
166
-
167
-
168
-
169
-
170
-
171
-
172
-
173
-
174
-
175
-
176
-
177
-
178
-
179
-
180
-
181
-
182
-
183
-
184
-
185
-
 186
186 -
 187
187 -
 188
188 -
 189
189 -
 190
190 -
 191
191 -
 192
192 -
 193
193 -
 194
194 -
 195
195 -
 196
196 -
 197
197 -
 198
198 -
 199
199 -
 200
200 -
 201
201 -
 202
202 -
 203
203 -
 204
204 -
 205
205 -
 206
206 -
207
-
208
-
209
-
210
-
211
-
212
-
213
-
214
-
215
-
216
-
217
-
218
-
219
-
220
-
221
-
222
-
223
-
224
-
225
-
226
-
227
-
228
-
229
-
230
-
231
 |
 |

14 Sustainability statements 14.5 - 14.5
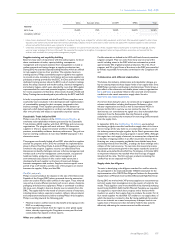
196 Annual Report 2012
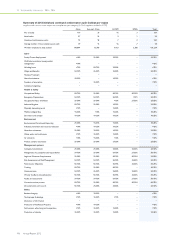
Summary of 2012 initial and continued conformance audit findings per region
suppliers with one or more major non-compliances per category (in % of suppliers audited in 2012)
China Asia excl. China LATAM EMEA Total
No. of audits 110 30 16 3 159
Initial audits 37 12 9 1 59
Continued conformance audits 73 18 7 2 100
Average number of non-compliance per audit 19 16 16 7 18
Workers employed at sites audited 102,494 12,789 6,163 2,788 124,234
Labor
Freely Chosen Employment1) <10% 25-50% 10-25% − 10-25%
Child labor avoidance /young worker
management2) <10% − − − <10%
Working hours >75% 50-75% 25-50% − >75%
Wages and Benefits 50-75% 25-50% 10-25% − 50-75%
Humane Treatment − − − − −
Non-discrimination 10-25% − 10-25% − <10%
Freedom of association − 10-25% − − <10%
Collective bargaining − − − − −
Health & Safety
Occupational Safety 50-75% 25-50% 50-75% 50-75% 50-75%
Emergency Preparedness 50-75% 50-75% 50-75% >75% 50-75%
Occupational Injury and Illness 25-50% 25-50% <10% 25-50% 25-50%
Industrial Hygiene 50-75% 25-50% 10-25% − 25-50%
Physically demanding work <10% − 10-25% − <10%
Machine safeguarding 10-25% <10% 10-25% − 10-25%
Dormitory and canteen 10-25% 10-25% 10-25% − 10-25%
Environment
Environmental Permits and Reporting 25-50% 10-25% 10-25% − 10-25%
Pollution prevention and resource reduction <10% 10-25% 10-25% − <10%
Hazardous substances 25-50% 10-25% 10-25% − 25-50%
Waste water and solid waste <10% 10-25% 10-25% − <10%
Air emissions <10% 10-25% <10% − <10%
Product content restrictions 25-50% 25-50% 25-50% − 25-50%
Management systems
Company Commitment 25-50% 25-50% 25-50% 25-50% 25-50%
Management Accountability and responsibility 50-75% 25-50% 50-75% 25-50% 50-75%
Legal and Customer Requirements 25-50% 25-50% 50-75% 50-75% 25-50%
Risk Assessment and Risk Management 50-75% 50-75% 50-75% 25-50% 50-75%
Performance Objectives 50-75% 50-75% 50-75% 25-50% 50-75%
Training 50-75% 25-50% 50-75% − 50-75%
Communication 50-75% 25-50% 25-50% 25-50% 50-75%
Worker feedback and participation 50-75% 50-75% 50-75% 25-50% 50-75%
Audits and assessments 50-75% 50-75% 50-75% 25-50% 50-75%
Corrective action process 50-75% 25-50% 50-75% 50-75% 50-75%
Documentation and records 50-75% 25-50% 25-50% − 25-50%
Ethics
Business Integrity <10% 10-25% − − <10%
No Improper Advantage <10% 10-25% <10% − <10%
Disclosure of information − − − − −
Protection of Intellectual Property <10% 10-25% − − <10%
Fair business, advertising and competition <10% 10-25% 10-25% − <10%
Protection of identity 10-25% 10-25% 10-25% − 10-25%