Philips 2012 Annual Report Download - page 176
Download and view the complete annual report
Please find page 176 of the 2012 Philips annual report below. You can navigate through the pages in the report by either clicking on the pages listed below, or by using the keyword search tool below to find specific information within the annual report.-
 1
1 -
2
-
3
-
4
-
5
-
6
-
7
-
8
-
9
-
10
-
11
-
12
-
13
-
14
-
15
-
16
-
17
-
18
-
19
-
20
-
21
-
22
-
23
-
24
-
25
-
26
-
27
-
28
-
29
-
30
-
31
-
32
-
33
-
34
-
35
-
36
-
37
-
38
-
39
-
40
-
41
-
42
-
43
-
44
-
45
-
46
-
47
-
48
-
49
-
50
-
51
-
52
-
53
-
54
-
55
-
56
-
57
-
58
-
59
-
60
-
61
-
62
-
63
-
64
-
65
-
66
-
67
-
68
-
69
-
70
-
71
-
72
-
73
-
74
-
75
-
76
-
77
-
78
-
79
-
80
-
81
-
82
-
83
-
84
-
85
-
86
-
87
-
88
-
89
-
90
-
91
-
92
-
93
-
94
-
95
-
96
-
97
-
98
-
99
-
100
-
101
-
102
-
103
-
104
-
105
-
106
-
107
-
108
-
109
-
110
-
111
-
112
-
113
-
114
-
115
-
116
-
117
-
118
-
119
-
120
-
121
-
122
-
123
-
124
-
125
-
126
-
127
-
128
-
129
-
130
-
131
-
132
-
133
-
134
-
135
-
136
-
137
-
138
-
139
-
140
-
141
-
142
-
143
-
144
-
145
-
146
-
147
-
148
-
149
-
150
-
151
-
152
-
153
-
154
-
155
-
156
-
157
-
158
-
159
-
160
-
161
-
162
-
163
-
164
-
165
-
 166
166 -
 167
167 -
 168
168 -
 169
169 -
 170
170 -
 171
171 -
 172
172 -
 173
173 -
 174
174 -
 175
175 -
 176
176 -
 177
177 -
 178
178 -
 179
179 -
 180
180 -
 181
181 -
 182
182 -
 183
183 -
 184
184 -
 185
185 -
 186
186 -
187
-
188
-
189
-
190
-
191
-
192
-
193
-
194
-
195
-
196
-
197
-
198
-
199
-
200
-
201
-
202
-
203
-
204
-
205
-
206
-
207
-
208
-
209
-
210
-
211
-
212
-
213
-
214
-
215
-
216
-
217
-
218
-
219
-
220
-
221
-
222
-
223
-
224
-
225
-
226
-
227
-
228
-
229
-
230
-
231
 |
 |

12 Group financial statements 12.11 - 12.11
176 Annual Report 2012
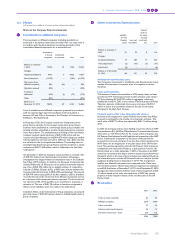
The following table outlines the estimated nominal value in millions of
euros for transaction exposure and related hedges for Philips’ most
significant currency exposures consolidated as of December 31, 2012:
Estimated transaction exposure and related hedges
in millions of euros
maturity 0-60 days maturity over 60 days
exposure hedges exposure hedges
Receivables
Functional vs. exposure currency
EUR vs. USD 454 (440) 1,803 (1,212)
USD vs. EUR 259 (226) 1,050 (553)
EUR vs. JPY 46 (45) 201 (139)
EUR vs. GBP 50 (43) 165 (94)
USD vs. JPY 32 (30) 182 (93)
EUR vs. PLN 40 (34) 60 (32)
USD vs. AUD 19 (14) 61 (31)
USD vs. CAD 15 (12) 62 (32)
CNY vs. EUR 17 (13) 58 (38)
USD vs. GBP 12 (9) 57 (29)
Others 154 (131) 338 (201)
Payables
Functional vs. exposure currency
EUR vs. USD (188) 184 (653) 435
USD vs. CNY (68) 68 (303) 173
EUR vs. PLN (34) 27 (151) 80
IDR vs. USD (28) 20 (108) 56
MXN vs. USD (15) 7 (100) 6
USD vs. SGD (17) 12 (87) 45
USD vs. MYR (12) 8 (65) 26
EUR vs. GBP (18) 17 (50) 27
CAD vs. USD (23) 17 (42) 23
BRL vs. USD (19) 16 (39) 13
Others (200) 184 (277) 167
The derivatives related to transactions are, for hedge accounting
purposes, split into hedges of on-balance-sheet accounts receivable/
payable and forecasted sales and purchases. Changes in the value of on-
balance-sheet foreign-currency accounts receivable/payable, as well as
the changes in the fair value of the hedges related to these exposures,
are reported in the income statement under costs of sales. Hedges
related to forecasted transactions, where hedge accounting is applied,
are accounted for as cash flow hedges. The results from such hedges
are deferred in other comprehensive income within equity to the
extent that the hedge is effective. As of December 31, 2012, a gain of
EUR 20 million was deferred in equity as a result of these hedges. The
result deferred in equity will be released to earnings mostly during 2013
at the time when the related hedged transactions affect the income
statement. During 2012, a net gain of EUR 8 million was recorded in
the income statement as a result of ineffectiveness on certain
anticipated cash flow hedges.
The total net fair value of hedges related to transaction exposure as of
December 31, 2012 was an unrealized asset of EUR 25 million. An
instantaneous 10% increase in the value of the euro against all
currencies would lead to a decrease of EUR 69 million in the value of
the derivatives; including a EUR 96 million decrease related to foreign
exchange transactions of the US dollar against the euro, a EUR 17
million decrease related to foreign exchange transactions of the
Japanese yen against euro, a EUR 8 million decrease related to foreign
exchange transactions of the Pound sterling, partially offset by a EUR
69 million increase related to foreign exchange transactions of the euro
against the US dollar.
The EUR 69 million decrease includes a loss of EUR 28 million that
would impact the income statement, which would largely offset the
opposite revaluation effect on the underlying accounts receivable and
payable, and the remaining loss of EUR 41 million would be recognized
in equity to the extent that the cash flow hedges were effective.
The total net fair value of hedges related to transaction exposure as of
December 31, 2011 was an unrealized asset of EUR 7 million. As of
February 2012, an instantaneous 10% increase in the value of the euro
against all currencies would have led to an increase of EUR 19 million
in the value of the derivatives; including a EUR 77 million increase
related to foreign exchange transactions of the euro against the US
dollar, partially offset by a EUR 17 million decrease related to foreign
exchange transactions of the US dollar against the euro, a EUR 14
million decrease related to foreign exchange transactions of the
Japanese yen against the euro, and a EUR 10 million decrease related
to foreign exchange transactions of the pound sterling.
Foreign exchange exposure also arises as a result of inter-company
loans and deposits. Where the Company enters into such arrangements
the financing is generally provided in the functional currency of the
subsidiary entity. The currency of the Company’s external funding and
liquid assets is matched with the required financing of subsidiaries either
directly through external foreign currency loans and deposits, or
synthetically by using foreign exchange derivatives. In certain cases
where group companies may also have external foreign currency debt
or liquid assets, these exposures are also hedged through the use of
foreign exchange derivatives. Changes in the fair value of hedges related
to this translation exposure are recognized within financial income and
expenses in the income statement. Translation exposure of foreign-
currency equity invested in consolidated entities may be hedged. If a
hedge is entered into, it is accounted for as a net investment hedge.
The total net fair value of these financing derivatives as of December
31, 2012, was a liability of EUR 404 million. An instantaneous 10%
increase in the value of the euro against all currencies would lead to an
increase of EUR 423 million in the value of the derivatives, including a
EUR 356 million increase related to the US dollar. The total amount
recorded in other comphresensieve income related to net investment
hedges in 2012 was EUR 14 million.
Philips does not currently hedge the foreign exchange exposure arising
from equity interests in non-functional-currency investments in
associates and available-for-sale financial assets.
Interest rate risk
Interest rate risk is the risk that the fair value or future cash flows of a
financial instrument will fluctuate because of changes in market interest
rates. Philips had outstanding debt of EUR 4,534 million, which created
an inherent interest rate risk. Failure to effectively hedge this risk could
negatively impact financial results. At year-end, Philips held EUR 3,834
million in cash and cash equivalents, total long-term debt of EUR 3,725
million and total short-term debt of EUR 809 million. At December 31,
2012, Philips had a ratio of fixed-rate long-term debt to total
outstanding debt of approximately 72%, compared to 73% one year
earlier.
A sensitivity analysis conducted as of January 2013 shows that if long-
term interest rates were to decrease instantaneously by 1% from their
level of December 31, 2012, with all other variables (including foreign
exchange rates) held constant, the fair value of the long-term debt
would increase by approximately EUR 422 million. If there was an
increase of 1% in long-term interest rates, this would reduce the market
value of the long-term debt by approximately EUR 339 million.
If interest rates were to increase instantaneously by 1% from their level
of December 31, 2012, with all other variables held constant, the
annualized net interest expense would decrease by approximately EUR
25 million. This impact was based on the outstanding net cash position
at December 31, 2012.
A sensitivity analysis conducted as of February 2012 showed that if
long-term interest rates were to decrease instantaneously by 1% from
their level of December 31, 2011, with all other variables (including
foreign exchange rates) held constant, the fair value of the long-term
debt would increase by approximately EUR 245 million. If there was an
increase of 1% in long-term interest rates, this would reduce the market
value of the long-term debt by approximately EUR 245 million.