Philips 2012 Annual Report Download - page 48
Download and view the complete annual report
Please find page 48 of the 2012 Philips annual report below. You can navigate through the pages in the report by either clicking on the pages listed below, or by using the keyword search tool below to find specific information within the annual report.-
 1
1 -
2
-
3
-
4
-
5
-
6
-
7
-
8
-
9
-
10
-
11
-
12
-
13
-
14
-
15
-
16
-
17
-
18
-
19
-
20
-
21
-
22
-
23
-
24
-
25
-
26
-
27
-
28
-
29
-
30
-
31
-
32
-
33
-
34
-
35
-
36
-
37
-
 38
38 -
 39
39 -
 40
40 -
 41
41 -
 42
42 -
 43
43 -
 44
44 -
 45
45 -
 46
46 -
 47
47 -
 48
48 -
 49
49 -
 50
50 -
 51
51 -
 52
52 -
 53
53 -
 54
54 -
 55
55 -
 56
56 -
 57
57 -
 58
58 -
59
-
60
-
61
-
62
-
63
-
64
-
65
-
66
-
67
-
68
-
69
-
70
-
71
-
72
-
73
-
74
-
75
-
76
-
77
-
78
-
79
-
80
-
81
-
82
-
83
-
84
-
85
-
86
-
87
-
88
-
89
-
90
-
91
-
92
-
93
-
94
-
95
-
96
-
97
-
98
-
99
-
100
-
101
-
102
-
103
-
104
-
105
-
106
-
107
-
108
-
109
-
110
-
111
-
112
-
113
-
114
-
115
-
116
-
117
-
118
-
119
-
120
-
121
-
122
-
123
-
124
-
125
-
126
-
127
-
128
-
129
-
130
-
131
-
132
-
133
-
134
-
135
-
136
-
137
-
138
-
139
-
140
-
141
-
142
-
143
-
144
-
145
-
146
-
147
-
148
-
149
-
150
-
151
-
152
-
153
-
154
-
155
-
156
-
157
-
158
-
159
-
160
-
161
-
162
-
163
-
164
-
165
-
166
-
167
-
168
-
169
-
170
-
171
-
172
-
173
-
174
-
175
-
176
-
177
-
178
-
179
-
180
-
181
-
182
-
183
-
184
-
185
-
186
-
187
-
188
-
189
-
190
-
191
-
192
-
193
-
194
-
195
-
196
-
197
-
198
-
199
-
200
-
201
-
202
-
203
-
204
-
205
-
206
-
207
-
208
-
209
-
210
-
211
-
212
-
213
-
214
-
215
-
216
-
217
-
218
-
219
-
220
-
221
-
222
-
223
-
224
-
225
-
226
-
227
-
228
-
229
-
230
-
231
 |
 |

5 Group performance 5.2 - 5.2.2
48 Annual Report 2012
5.2 Social
performance
Our businesses provide innovative solutions that address
major trends affecting the world – the demand for
affordable healthcare, the need for greater energy
efficiency and the desire for personal well-being.
In 2012, Philips maintained its focus on sustainability. This
is rooted in our long-standing belief that sustainability is a
key enabler of growth and offers opportunities to
innovate our way out of the economic crisis. Therefore,
sustainability is an integral part of Philips’ vision and
strategy.
5.2.1 Improving people’s lives
The creation of Philips products and solutions that
directly support the curative or preventive side of
people’s health was one of the key objectives of our
EcoVision5 program with a target of 500 million lives
improved in 2015. By year-end 2012, we were already at a
level of 570 million lives, driven by our Healthcare sector.
With the renewal of our company vision in 2012 we have
extended this approach with our well-being products that
help people live a healthy life, as well as our Green
Products that contribute to a healthy ecosystem. Our goal
is to improve the lives of 3 billion people a year by 2025.
For the year 2012 we have established our total baseline
at 1.7 billion people a year. More information on this
metric can be found in chapter 14, Sustainability
statements, of this Annual Report.
Lives improved by Philips in 2012
1.4
0.57
1.7 (double counts eliminated)
By Philips
green products
0.24
By Philips
well-being
products
By Philips
care products
Double counts
Numbers in billions
Conceptual drawing, areas do not reflect actual proportions
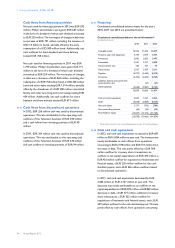
5.2.2 Employee engagement
At Philips, we believe that employee engagement is an
important measure that helps us to manage and develop
our human capital and stimulate business growth through
our people. Our 2011 Employee Engagement Survey (EES)
showed that our overall engagement scores at Philips
were in line with external high performance norms.
Employee Engagement Index
in % ■-favorable--■-neutral--■-unfavorable
100
75
50
25
0
2008
72
16
12
2009
71
15
14
2010
77
12
11
2011
76
14
10
20121)
79
15 6
1) Based on 60 pulse surveys conducted in 2012
In 2012 we announced our intention to move from an
annual measurement of EES data to a bi-annual basis to
allow more time for teams to analyze results and enact
improvement actions, as well as to create an opportunity
to review the way we approach engagement. Through
these measures, we hope to identify how we can improve
the link between the high levels of employee engagement
that we are achieving and improved business results.
We remain committed to creating a great place to work
for our employees in line with our corporate vision. We
will use the additional time before the next EES to drive
existing action plans and, where applicable, begin new
actions designed to improve employee engagement.
Through our internal social media tool ‘Connect Us’ and
an open SharePoint site we provide forums for managers
and employees to share best practices and ask questions
on the topic of engagement.
We also continue to use pulse surveys to measure
engagement levels in certain teams such as new
acquisitions or groups going through significant changes.
While this does not provide a statistical comparison to
the total organization results of the past, it does provide
insight into progress being made for these teams. In 2012
we deployed over 60 pulse surveys touching nearly 2,000
employees. In previous years over 80% of the Philips
employees participated in the EES.