Philips 2012 Annual Report Download - page 193
Download and view the complete annual report
Please find page 193 of the 2012 Philips annual report below. You can navigate through the pages in the report by either clicking on the pages listed below, or by using the keyword search tool below to find specific information within the annual report.-
 1
1 -
2
-
3
-
4
-
5
-
6
-
7
-
8
-
9
-
10
-
11
-
12
-
13
-
14
-
15
-
16
-
17
-
18
-
19
-
20
-
21
-
22
-
23
-
24
-
25
-
26
-
27
-
28
-
29
-
30
-
31
-
32
-
33
-
34
-
35
-
36
-
37
-
38
-
39
-
40
-
41
-
42
-
43
-
44
-
45
-
46
-
47
-
48
-
49
-
50
-
51
-
52
-
53
-
54
-
55
-
56
-
57
-
58
-
59
-
60
-
61
-
62
-
63
-
64
-
65
-
66
-
67
-
68
-
69
-
70
-
71
-
72
-
73
-
74
-
75
-
76
-
77
-
78
-
79
-
80
-
81
-
82
-
83
-
84
-
85
-
86
-
87
-
88
-
89
-
90
-
91
-
92
-
93
-
94
-
95
-
96
-
97
-
98
-
99
-
100
-
101
-
102
-
103
-
104
-
105
-
106
-
107
-
108
-
109
-
110
-
111
-
112
-
113
-
114
-
115
-
116
-
117
-
118
-
119
-
120
-
121
-
122
-
123
-
124
-
125
-
126
-
127
-
128
-
129
-
130
-
131
-
132
-
133
-
134
-
135
-
136
-
137
-
138
-
139
-
140
-
141
-
142
-
143
-
144
-
145
-
146
-
147
-
148
-
149
-
150
-
151
-
152
-
153
-
154
-
155
-
156
-
157
-
158
-
159
-
160
-
161
-
162
-
163
-
164
-
165
-
166
-
167
-
168
-
169
-
170
-
171
-
172
-
173
-
174
-
175
-
176
-
177
-
178
-
179
-
180
-
181
-
182
-
 183
183 -
 184
184 -
 185
185 -
 186
186 -
 187
187 -
 188
188 -
 189
189 -
 190
190 -
 191
191 -
 192
192 -
 193
193 -
 194
194 -
 195
195 -
 196
196 -
 197
197 -
 198
198 -
 199
199 -
 200
200 -
 201
201 -
 202
202 -
 203
203 -
204
-
205
-
206
-
207
-
208
-
209
-
210
-
211
-
212
-
213
-
214
-
215
-
216
-
217
-
218
-
219
-
220
-
221
-
222
-
223
-
224
-
225
-
226
-
227
-
228
-
229
-
230
-
231
 |
 |

14 Sustainability statements 14.3 - 14.4
Annual Report 2012 193
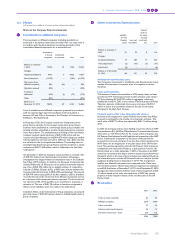
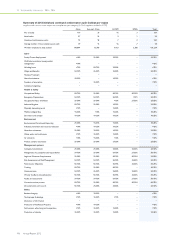
ISO 14001 certification
as a % of all reporting organizations
2008 2009 2010 2011 2012
Philips Group 95 92 95 89 71
Environmental Incidents
In 2012, 2 incidents were reported by Healthcare related to water.
There were no fines reported in our sustainability reporting tool in
connection with one of the incidents.
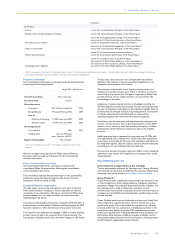
14.4 General Business Principles
The analysis is based upon 374 reports submitted in 2012 relating to
alleged violations of the General Business Principles (GBP), compared
to 269 in 2011.
We see a considerable increase in number of complaints reported,
which can be attributed mainly to an increase in number of complaints in
North America, which accounted for 47% of all complaints (2011: 32%).
This dominance in North America we believe is due to a corporate
culture in which employees are very much aware of compliance issues,
their rights and the opportunities for reporting potential violations. A
considerable decrease in complaints reported is shown in Latin
America (2012: 21%; 2011: 32%). The management attention and
additional training in 2012 including the launch of a ‘Mutual Respect’ e-
training in Brazil early 2012 we believe may have contributed to this
decline. With 15% of the total number of reported complaints, Europe
and the Middle East region show a relative decrease in comparison to
2011 (19%). A minor increase is witnessed in the Asia Pacific region,
which accounted for 18% of all reports (2011: 17%).
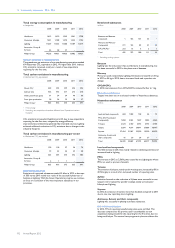
Most common types of alleged violations
Treatment of employees
The most common alleged violations remain related to the Treatment
of employees category, which represented 55% of all violations (2011:
49%).
As in 2011, the vast majority of the Treatment of employees complaints
(almost 85%) remains related to two issues – Discrimination and
Respectful treatment. The increase in number of complaints this year
can be attributed to the increase related to these two issues.
Complaints regarding Discrimination mainly relate to discrimination
based on gender and favoritism, and originated principally in the US and
Brazil. Of the complaints reported in the US, 30% related to
discrimination, and of the complaints reported in Brazil, 14% related to
discrimination, whereas that figure was 19% for Philips. For Brazil, this is
a notable decline in percentage in comparison to last year (23%).
Most complaints regarding lack of Respectful treatment – primarily
verbal abuse, (sexual) harassment and unfair treatment– again come
from the US and Brazil. Of the complaints reported in the US, 37%
related to respectful treatment; of the complaints reported in Brazil,
32% related to respectful treatment; compared to 27% for Philips as a
whole.
Business integrity
In second place, with 32% of the total number of complaints, are
allegations in the Business integrity category (2011: 40%).
Supply Management
All employees who are performing (certain) purchasing functions
should adhere to and fully comply with the Philips Supply Management
Code of Ethics. As in the previous two years, we witnessed a low
number of complaints in this regard in 2012, with only 3 complaints
concerning alleged violations of the Code (2011: 3 complaints).
More information on these categories can be found in the GBP
Directives on www.philips.com/gbp.
Breakdown of alleged violations GBP
2008 2009 2010 2011 2012
Health & Safety 10 6 3 2 11
Treatment of
employees 197 162 184 132 205
- Collective bargaining 1 − 1 − 1
- Discrimination 76 63 64 41 72
- Employee development 8 3 1 − −
- Employee privacy 2 2 2 1 1
- Employee relations 14 15 4 1 2
- Respectful treatment 81 53 96 71 102
- Remuneration 7 22 12 6 15
- Right to organize − − − − 1
- Working hours 8 4 4 2 −
- HR other − − − 10 11
Legal 8 4 13 10 19
Business Integrity 62 88 112 107 119
Supply management 5 4 4 3 3
Other 78 54 22 15 17
Total 360 318 338 269 374
Actual violations versus not proven allegations
Although 76 of the 374 GBP complaints reported in 2012 are still
pending (especially those lodged during the last three months of the
year), the table of investigated complaints provides an initial indication
of the number of substantiated violations compared to the number of
complaints which, upon investigation, could not be substantiated.
Out of the 298 complaints investigated, it was found that roughly one
quarter (26%) were justified, considerably lower than in 2011 (32%).
With regard to complaints regarding Treatment of employees, there
was a considerable decrease in the number of justified complaints to
13% of the total number of complaints in this category (2011: 21%).
In the other major category, i.e. the investigated complaints in the
Business integrity category, the percentage of complaints that were
justified decreased slightly to 42% (2011: 43%).
A range of disciplinary and corrective measures have been implemented
as a result of established violations of the General Business Principles,
ranging from dismissal and written warnings to awareness training
sessions and organizational measures.