Philips 2012 Annual Report Download - page 42
Download and view the complete annual report
Please find page 42 of the 2012 Philips annual report below. You can navigate through the pages in the report by either clicking on the pages listed below, or by using the keyword search tool below to find specific information within the annual report.-
 1
1 -
2
-
3
-
4
-
5
-
6
-
7
-
8
-
9
-
10
-
11
-
12
-
13
-
14
-
15
-
16
-
17
-
18
-
19
-
20
-
21
-
22
-
23
-
24
-
25
-
26
-
27
-
28
-
29
-
30
-
31
-
 32
32 -
 33
33 -
 34
34 -
 35
35 -
 36
36 -
 37
37 -
 38
38 -
 39
39 -
 40
40 -
 41
41 -
 42
42 -
 43
43 -
 44
44 -
 45
45 -
 46
46 -
 47
47 -
 48
48 -
 49
49 -
 50
50 -
 51
51 -
 52
52 -
53
-
54
-
55
-
56
-
57
-
58
-
59
-
60
-
61
-
62
-
63
-
64
-
65
-
66
-
67
-
68
-
69
-
70
-
71
-
72
-
73
-
74
-
75
-
76
-
77
-
78
-
79
-
80
-
81
-
82
-
83
-
84
-
85
-
86
-
87
-
88
-
89
-
90
-
91
-
92
-
93
-
94
-
95
-
96
-
97
-
98
-
99
-
100
-
101
-
102
-
103
-
104
-
105
-
106
-
107
-
108
-
109
-
110
-
111
-
112
-
113
-
114
-
115
-
116
-
117
-
118
-
119
-
120
-
121
-
122
-
123
-
124
-
125
-
126
-
127
-
128
-
129
-
130
-
131
-
132
-
133
-
134
-
135
-
136
-
137
-
138
-
139
-
140
-
141
-
142
-
143
-
144
-
145
-
146
-
147
-
148
-
149
-
150
-
151
-
152
-
153
-
154
-
155
-
156
-
157
-
158
-
159
-
160
-
161
-
162
-
163
-
164
-
165
-
166
-
167
-
168
-
169
-
170
-
171
-
172
-
173
-
174
-
175
-
176
-
177
-
178
-
179
-
180
-
181
-
182
-
183
-
184
-
185
-
186
-
187
-
188
-
189
-
190
-
191
-
192
-
193
-
194
-
195
-
196
-
197
-
198
-
199
-
200
-
201
-
202
-
203
-
204
-
205
-
206
-
207
-
208
-
209
-
210
-
211
-
212
-
213
-
214
-
215
-
216
-
217
-
218
-
219
-
220
-
221
-
222
-
223
-
224
-
225
-
226
-
227
-
228
-
229
-
230
-
231
 |
 |

5 Group performance 5.1.13 - 5.1.15
42 Annual Report 2012
For details, please refer to note 7, Acquisitions and
divestments.
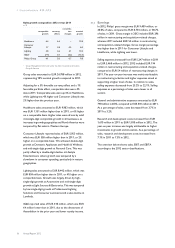
5.1.14 Performance by geographic cluster
In 2012, sales grew 4% on a comparable basis (10%
nominally), driven by growth in Healthcare, notably in
growth geographies.
Comparable sales growth by geographic cluster1)
in %
■-Philips Group--■-growth geographies--■-mature geographies
15
10
5
0
4.8
13.6
1.2
2010
4.1
11.1
1.0
2011
4.1
10.1
1.2
2012
1) For a reconciliation to the most directly comparable GAAP measures, see
chapter 15, Reconciliation of non-GAAP information, of this Annual Report
Sales in mature geographies were EUR 1,059 million
higher than in 2011, or 1% higher on a comparable basis.
Sales in Western Europe were impacted by the
macroeconomic developments, resulting in a 3% decline
in comparable sales, attributable to all sectors. On a
nominal basis, sales in Western Europe were largely
unchanged from the prior year, driven by the acquisition
of Indal in Lighting. Sales in North America were EUR 694
million higher, or 2% higher on a comparable basis, driven
by single-digit growth in all sectors. Both nominal and
comparable sales in other mature geographies showed
strong growth. Comparable sales in other mature
geographies double-digit growth in all sectors.
In growth geographies, sales grew by EUR 1,150 million,
or 10% on a comparable basis, driven by double-digit
growth at Healthcare. In China, Healthcare and Lighting
recorded solid double-digit nominal and comparable
growth. Sales in Russia also showed double-digit growth,
attributable to strong sales performance at Consumer
Lifestyle and Healthcare.
Sales per geographic cluster
in millions of euros
■-Western Europe_■-North America_■-other mature_■-growth
30,000
20,000
10,000
0
2010
6,630
7,086
1,618
6,953
22,287
2011
6,368
6,978
1,741
7,492
22,579
2012
6,373
7,672
2,101
8,642
24,788
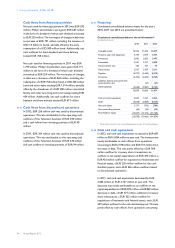
5.1.15 Cash flows provided by continuing
operations
Cash flows from operating activities
Net cash flow from operating activities amounted to EUR
2,198 million in 2012, compared to EUR 768 million in
2011. The year-on-year improvement was largely
attributable to lower working capital outflows, mainly
related to accounts payable, as well as higher cash
earnings. The increase in other current liabilities includes
a payable of EUR 509 million related to the European
Commission fine for alleged violations of competition
rules in the Cathode-Ray Tube (CRT) industry. Excluding
the CRT payable, the increase in accounts payable and
accrued and other current liabilities was attributable to
increased volume from higher sales, while the outflow in
2011 was attributable to a tightening of vendor payments
in the operating sectors.
Cash flows from operating activities
and net capital expenditures
in millions of euros
■-cash flows from operating activities--■-net capital expenditures
2,500
2,000
1,500
1,000
500
0
(500)
(1,000)
1,883
(766)
2008
1,354
(590)
2009
2,074
(716)
2010
768
(872)
2011
2,198
(475)
2012