Philips 2012 Annual Report Download - page 149
Download and view the complete annual report
Please find page 149 of the 2012 Philips annual report below. You can navigate through the pages in the report by either clicking on the pages listed below, or by using the keyword search tool below to find specific information within the annual report.-
 1
1 -
2
-
3
-
4
-
5
-
6
-
7
-
8
-
9
-
10
-
11
-
12
-
13
-
14
-
15
-
16
-
17
-
18
-
19
-
20
-
21
-
22
-
23
-
24
-
25
-
26
-
27
-
28
-
29
-
30
-
31
-
32
-
33
-
34
-
35
-
36
-
37
-
38
-
39
-
40
-
41
-
42
-
43
-
44
-
45
-
46
-
47
-
48
-
49
-
50
-
51
-
52
-
53
-
54
-
55
-
56
-
57
-
58
-
59
-
60
-
61
-
62
-
63
-
64
-
65
-
66
-
67
-
68
-
69
-
70
-
71
-
72
-
73
-
74
-
75
-
76
-
77
-
78
-
79
-
80
-
81
-
82
-
83
-
84
-
85
-
86
-
87
-
88
-
89
-
90
-
91
-
92
-
93
-
94
-
95
-
96
-
97
-
98
-
99
-
100
-
101
-
102
-
103
-
104
-
105
-
106
-
107
-
108
-
109
-
110
-
111
-
112
-
113
-
114
-
115
-
116
-
117
-
118
-
119
-
120
-
121
-
122
-
123
-
124
-
125
-
126
-
127
-
128
-
129
-
130
-
131
-
132
-
133
-
134
-
135
-
136
-
137
-
138
-
 139
139 -
 140
140 -
 141
141 -
 142
142 -
 143
143 -
 144
144 -
 145
145 -
 146
146 -
 147
147 -
 148
148 -
 149
149 -
 150
150 -
 151
151 -
 152
152 -
 153
153 -
 154
154 -
 155
155 -
 156
156 -
 157
157 -
 158
158 -
 159
159 -
160
-
161
-
162
-
163
-
164
-
165
-
166
-
167
-
168
-
169
-
170
-
171
-
172
-
173
-
174
-
175
-
176
-
177
-
178
-
179
-
180
-
181
-
182
-
183
-
184
-
185
-
186
-
187
-
188
-
189
-
190
-
191
-
192
-
193
-
194
-
195
-
196
-
197
-
198
-
199
-
200
-
201
-
202
-
203
-
204
-
205
-
206
-
207
-
208
-
209
-
210
-
211
-
212
-
213
-
214
-
215
-
216
-
217
-
218
-
219
-
220
-
221
-
222
-
223
-
224
-
225
-
226
-
227
-
228
-
229
-
230
-
231
 |
 |

12 Group financial statements 12.11 - 12.11 9
Annual Report 2012 149
Capitalized interest included in capital expenditures is not significant.
Changes in expected useful lives and residual values have an insignificant
effect on depreciation in current and future years.
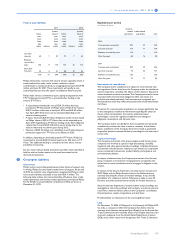
9Goodwill
The changes in 2011 and 2012 were as follows:
2011 2012
Balance as of January 1:
Cost 8,742 9,224
Amortization / Impairments (707) (2,208)
Book value 8,035 7,016
Changes in book value:
Acquisitions 225 98
Divestments (8) (6)
Impairments (1,355) −
Transfer to assets classified as held for sale (5) −
Translation differences 124 (160)
Balance as of December 31:
Cost 9,224 9,119
Amortization / Impairments (2,208) (2,171)
Book value 7,016 6,948
Acquisitions in 2012 include goodwill related to the acquisition of Indal
for EUR 100 million. In addition, goodwill changed due to the finalization
of purchase price accounting related to acquisitions in the prior year.
Acquisitions in 2011 include mainly the goodwill related to the
acquisition of Povos (kitchen appliances) for EUR 102 million, Sectra
(mammography business operations) EUR 41 million and Optimum
Lighting EUR 30 million.
For impairment testing, goodwill is allocated to (groups of) cash-
generating units (typically one level below operating sector level), which
represents the lowest level at which the goodwill is monitored
internally for management purposes.
In 2012, the organizational structure of the Lighting sector was changed.
As a result of the change, the goodwill associated with the former unit
Lamps was allocated to Light Sources & Electronics. In addition, the
goodwill associated with the former Lighting Systems & Controls unit
was allocated to Light Sources & Electronics and to Professional
Lighting Solutions (former name was Professional Luminaires).
Goodwill allocated to the cash-generating units Respiratory Care &
Sleep Management, Imaging Systems, Patient Care & Clinical Informatics
and Professional Lighting Solutions is considered to be significant in
comparison to the total book value of goodwill for the Group at
December 31, 2012. The amounts allocated are presented below:
2011 2012
Respiratory Care & Sleep Management 1,779 1,706
Imaging Systems 1,507 1,482
Patient Care & Clinical Informatics 1,360 1,331
Professional Lighting Solutions 1,2601) 1,337
1) Revised to reflect the new organizational structure of the Lighting sector
The basis of the recoverable amount used in the annual (performed in
the second quarter) and trigger-based impairment tests is the value in
use. Key assumptions used in the impairment tests for the units in the
table above were sales growth rates, income from operations and the
rates used for discounting the projected cash flows. These cash flow
projections were determined using management’s internal forecasts
that cover an initial period from 2012 to 2016 that matches the period
used for our strategic process. Projections were extrapolated with
stable or declining growth rates for a period of 5 years, after which a
terminal value was calculated. For terminal value calculation, growth
rates were capped at a historical long-term average growth rate.
The sales growth rates and margins used to estimate cash flows are
based on past performance, external market growth assumptions and
industry long-term growth averages.
Income from operations in all units is expected to increase over the
projection period as a result of volume growth and cost efficiencies.
Cash flow projections of Respiratory Care & Sleep Management,
Imaging Systems, Patient Care & Clinical Informatics and Professional
Lighting Solutions for 2012 were based on the following key
assumptions (based on the annual impairment test performed in the
second quarter):
in %
compound sales growth rate1)
initial
forecast
period
extra-
polation
period2)
used to
calculate
terminal
value
pre-tax
discount
rates
Respiratory Care & Sleep
Management 8.0 5.8 2.7 11.2
Imaging Systems 3.4 2.9 2.7 12.8
Patient Care & Clinical
Informatics 6.5 4.1 2.7 13.2
Professional Lighting Solutions 6.6 5.3 2.7 13.0
1) Compound sales growth rate is the annualized steady growth rate over the
forecast period
2) Also referred to later in the text as compound long-term sales growth rate
The assumptions used for the 2011 cash flow projections were as
follows:
in %
compound sales growth rate1)
forecast
period
extra-
polation
period2)
used to
calculate
terminal
value
pre-tax
discount
rates
Respiratory Care & Sleep
Management 7.6 5.6 2.7 11.5
Imaging Systems 7.2 4.7 2.7 11.8
Patient Care & Clinical
Informatics 8.2 5.6 2.7 13.4
Professional Luminaires 9.5 6.1 2.7 13.6
1) Compound sales growth rate is the annualized steady growth rate over the
forecast period
2) Also referred to later in the text as compound long-term sales growth rate
The headroom of Respiratory Care & Sleep Management was estimated
at EUR 560 million. The following changes could, individually, cause the
value in use to fall to the level of the carrying value:
increase in
pre-tax
discount rate,
basis points
decrease in
long-term
growth rate,
basis points
decrease in
terminal value
amount, %
Respiratory Care & Sleep
Management 210 400 30.0