Philips 2012 Annual Report Download - page 44
Download and view the complete annual report
Please find page 44 of the 2012 Philips annual report below. You can navigate through the pages in the report by either clicking on the pages listed below, or by using the keyword search tool below to find specific information within the annual report.-
 1
1 -
2
-
3
-
4
-
5
-
6
-
7
-
8
-
9
-
10
-
11
-
12
-
13
-
14
-
15
-
16
-
17
-
18
-
19
-
20
-
21
-
22
-
23
-
24
-
25
-
26
-
27
-
28
-
29
-
30
-
31
-
32
-
33
-
 34
34 -
 35
35 -
 36
36 -
 37
37 -
 38
38 -
 39
39 -
 40
40 -
 41
41 -
 42
42 -
 43
43 -
 44
44 -
 45
45 -
 46
46 -
 47
47 -
 48
48 -
 49
49 -
 50
50 -
 51
51 -
 52
52 -
 53
53 -
 54
54 -
55
-
56
-
57
-
58
-
59
-
60
-
61
-
62
-
63
-
64
-
65
-
66
-
67
-
68
-
69
-
70
-
71
-
72
-
73
-
74
-
75
-
76
-
77
-
78
-
79
-
80
-
81
-
82
-
83
-
84
-
85
-
86
-
87
-
88
-
89
-
90
-
91
-
92
-
93
-
94
-
95
-
96
-
97
-
98
-
99
-
100
-
101
-
102
-
103
-
104
-
105
-
106
-
107
-
108
-
109
-
110
-
111
-
112
-
113
-
114
-
115
-
116
-
117
-
118
-
119
-
120
-
121
-
122
-
123
-
124
-
125
-
126
-
127
-
128
-
129
-
130
-
131
-
132
-
133
-
134
-
135
-
136
-
137
-
138
-
139
-
140
-
141
-
142
-
143
-
144
-
145
-
146
-
147
-
148
-
149
-
150
-
151
-
152
-
153
-
154
-
155
-
156
-
157
-
158
-
159
-
160
-
161
-
162
-
163
-
164
-
165
-
166
-
167
-
168
-
169
-
170
-
171
-
172
-
173
-
174
-
175
-
176
-
177
-
178
-
179
-
180
-
181
-
182
-
183
-
184
-
185
-
186
-
187
-
188
-
189
-
190
-
191
-
192
-
193
-
194
-
195
-
196
-
197
-
198
-
199
-
200
-
201
-
202
-
203
-
204
-
205
-
206
-
207
-
208
-
209
-
210
-
211
-
212
-
213
-
214
-
215
-
216
-
217
-
218
-
219
-
220
-
221
-
222
-
223
-
224
-
225
-
226
-
227
-
228
-
229
-
230
-
231
 |
 |

5 Group performance 5.1.16 - 5.1.18
44 Annual Report 2012
Cash flows from financing activities
Net cash used for financing activities in 2012 was EUR 292
million. Philips’ shareholders were given EUR 687 million
in the form of a dividend of which cash dividend amounted
to EUR 255 million. The net impact of changes in debt was
an increase of EUR 731 million, including the issuance of
USD 1.5 billion in bonds, partially offset by the early
redemption of a USD 500 million bond. Additionally, net
cash outflows for share buyback and share delivery
totaled EUR 768 million.
Net cash used for financing activities in 2011 was EUR
1,790 million. Philips’ shareholders were given EUR 711
million in the form of a dividend of which cash dividend
amounted to EUR 259 million. The net impact of changes
in debt was a decrease of EUR 860 million, including the
redemption of a EUR 750 million bond, a USD 350 million
bond and other debts totaling EUR 1,314 million, partially
offset by the drawdown of a EUR 200 million committed
facility and other new long-term borrowing totaling EUR
454 million. Additionally, net cash outflows for share
buyback and share delivery totaled EUR 671 million.
5.1.16 Cash flows from discontinued operations
In 2012, EUR 256 million cash was used by discontinued
operations. This was attributable to the operating cash
outflows of the Television business of EUR 296 million
and a cash inflow from investing activities of EUR 40
million.
In 2011, EUR 364 million cash was used by discontinued
operations. This was attributable to the operating cash
outflows of the Television business of EUR 270 million
and cash outflow to investing activities of EUR 94 million.
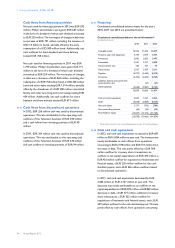
5.1.17 Financing
Condensed consolidated balance sheets for the years
2010, 2011 and 2012 are presented below:
Condensed consolidated balance sheet information1)
in millions of euros
2010 2011 2012
Intangible assets 12,233 11,012 10,679
Property, plant and equipment 3,145 3,014 2,959
Inventories 3,865 3,625 3,495
Receivables 4,947 5,117 4,858
Assets held for sale 120 551 43
Other assets 2,567 2,929 3,211
Payables (6,977) (6,563) (6,210)
Provisions (2,394) (2,694) (2,969)
Liabilities directly associated with
assets held for sale − (61) (27)
Other liabilities (3,628) (3,867) (4,165)
13,878 13,063 11,874
Cash and cash equivalents 5,833 3,147 3,834
Debt (4,658) (3,860) (4,534)
Net cash (debt) 1,175 (713) (700)
Non-controlling interests (46) (34) (34)
Shareholders’ equity (15,007) (12,316) (11,140)
(13,878) (13,063) (11,874)
1) Please refer to section 12.6, Consolidated balance sheets, of this Annual Report
5.1.18 Cash and cash equivalents
In 2012, cash and cash equivalents increased by EUR 687
million to EUR 3,834 million at year-end. The increase was
mainly attributable to cash inflows from operations
amounting to EUR 2,198 million and EUR 731 million from
increases in debt. This was partly offset by a EUR 768
million outflow for treasury share transactions, an
outflow on net capital expenditures of EUR 475 million, a
EUR 426 million outflow for acquisitions of businesses and
financial assets, a EUR 255 million outflow for the cash
dividend payout, and a EUR 256 million outflow related
to discontinued operations.
In 2011, cash and cash equivalents decreased by EUR
2,686 million to EUR 3,147 million at year-end. The
decrease was mainly attributable to an outflow on net
capital expenditures of EUR 872 million, a EUR 860 million
decrease in debt, a EUR 671 million outflow for treasury
share transactions, a EUR 552 million outflow for
acquisitions of businesses and financial assets, and a EUR
259 million outflow for the cash dividend payout. This was
partly offset by cash inflows from operations amounting