Philips 2012 Annual Report Download - page 150
Download and view the complete annual report
Please find page 150 of the 2012 Philips annual report below. You can navigate through the pages in the report by either clicking on the pages listed below, or by using the keyword search tool below to find specific information within the annual report.-
 1
1 -
2
-
3
-
4
-
5
-
6
-
7
-
8
-
9
-
10
-
11
-
12
-
13
-
14
-
15
-
16
-
17
-
18
-
19
-
20
-
21
-
22
-
23
-
24
-
25
-
26
-
27
-
28
-
29
-
30
-
31
-
32
-
33
-
34
-
35
-
36
-
37
-
38
-
39
-
40
-
41
-
42
-
43
-
44
-
45
-
46
-
47
-
48
-
49
-
50
-
51
-
52
-
53
-
54
-
55
-
56
-
57
-
58
-
59
-
60
-
61
-
62
-
63
-
64
-
65
-
66
-
67
-
68
-
69
-
70
-
71
-
72
-
73
-
74
-
75
-
76
-
77
-
78
-
79
-
80
-
81
-
82
-
83
-
84
-
85
-
86
-
87
-
88
-
89
-
90
-
91
-
92
-
93
-
94
-
95
-
96
-
97
-
98
-
99
-
100
-
101
-
102
-
103
-
104
-
105
-
106
-
107
-
108
-
109
-
110
-
111
-
112
-
113
-
114
-
115
-
116
-
117
-
118
-
119
-
120
-
121
-
122
-
123
-
124
-
125
-
126
-
127
-
128
-
129
-
130
-
131
-
132
-
133
-
134
-
135
-
136
-
137
-
138
-
139
-
 140
140 -
 141
141 -
 142
142 -
 143
143 -
 144
144 -
 145
145 -
 146
146 -
 147
147 -
 148
148 -
 149
149 -
 150
150 -
 151
151 -
 152
152 -
 153
153 -
 154
154 -
 155
155 -
 156
156 -
 157
157 -
 158
158 -
 159
159 -
 160
160 -
161
-
162
-
163
-
164
-
165
-
166
-
167
-
168
-
169
-
170
-
171
-
172
-
173
-
174
-
175
-
176
-
177
-
178
-
179
-
180
-
181
-
182
-
183
-
184
-
185
-
186
-
187
-
188
-
189
-
190
-
191
-
192
-
193
-
194
-
195
-
196
-
197
-
198
-
199
-
200
-
201
-
202
-
203
-
204
-
205
-
206
-
207
-
208
-
209
-
210
-
211
-
212
-
213
-
214
-
215
-
216
-
217
-
218
-
219
-
220
-
221
-
222
-
223
-
224
-
225
-
226
-
227
-
228
-
229
-
230
-
231
 |
 |

10 12 Group financial statements 12.11 - 12.11
150 Annual Report 2012
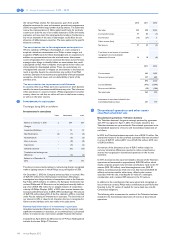
Based on the annual impairment test, it was noted that for Professional
Lighting Solutions the estimated recoverable amount approximates the
carrying value of the cash-generating unit. Consequently, any adverse
change in key assumptions would, individually, cause an impairment loss
to be recognized.
The results of the annual impairment test of Imaging Systems and
Patient Care & Clinical Informatics have indicated that a reasonably
possible change in key assumptions would not cause the value in use to
fall to the level of the carrying value.
Additional information 2012
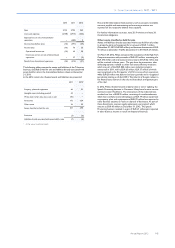
Other cash-generating units, to which a lower amount of goodwill is
allocated, are sensitive to fluctuations in the assumptions as set out
above.
Based on the annual impairment test, it was noted that the headroom
for the cash-generating unit Home Monitoring was EUR 49 million. An
increase of 140 points in pre-tax discounting rate, a 250 basis points
decline in the compound long-term sales growth rate or a 20 %
decrease in terminal value would cause its value in use to fall to the
level of its carrying value. The goodwill allocated to Home Monitoring at
at December 31, 2012 amounted to EUR 42 million.
Based on the annual impairment test, it was noted that the headroom
for the cash-generating unit Consumer Luminaires was EUR 153
million. An increase of 380 points in pre-tax discounting rate, a 710
basis points decline in the compound long-term sales growth rate or a
52 % decrease in terminal value would cause its value in use to fall to
the level of its carrying value. The goodwill allocated to Consumer
Luminaires at December 31, 2012 amounted to EUR 133 million.
Based on the Q4 trigger-based impairment test, it was noted that the
headroom for the cash-generating unit Lumileds was EUR 174 million.
An increase of 150 basis points in pre-tax discounting rate, a 400 basis
points decline in the compound long-term sales growth or a 19%
decrease in terminal value would cause its value in use to fall to the
level of its carrying value. The goodwill allocated to Lumileds at
December 31, 2012 amounted to EUR 132 million.
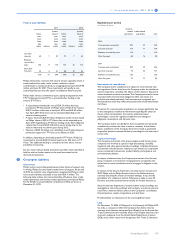
Impairment charge 2011
Based on the annual test in 2011 the recoverable amounts for certain
cash-generating units were estimated to be lower than the carrying
amounts, and therefore impairment was identified as follows:
Cash-generating unit
reportable
segment
amount of
impairment
Respiratory Care & Sleep Management Healthcare 450
Home Monitoring Healthcare 374
Professional Luminaires Lighting 304
Consumer Luminaires Lighting 227
Respiratory Care & Sleep Management
The annual impairment test resulted in EUR 450 million impairment.
This was mainly as a consequence of a weaker market outlook, lower
profitability projections from increasing investments and price
competitition, as well as an adverse movement in the pre-tax discount
rate.
Home Monitoring
The annual impairment test resulted in EUR 374 million impairment.
This was mainly as a consequence of lower growth projections,
particularly in the US markets, and lower profitability projections based
on historical performance.
The pre-tax discount rate applied to the 2011 cash flow projection is
11.6%.
Professional Luminaires
The annual impairment test resulted in EUR 304 million impairment, as
a consequence of lower growth projections, lower profitability and
higher investment levels required.
Consumer Luminaires
The annual impairment test resulted in EUR 227 million impairment.
This was mainly as a consequence of lower growth projections on
slower than anticipated recovery of the market, a slower LED adoption
rate and an adverse movement in the pre-tax discount rate.
The pre-tax discount rate applied to the 2011 cash flow projection is
12.6%.
Please refer to section 12.9, Information by sector and main country,
of this Annual Report for a specification of goodwill by sector.
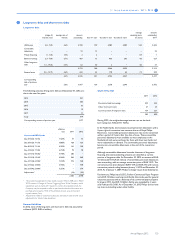
10 Intangible assets excluding goodwill
The changes were as follows:
other intangible
assets
product
development software total
Balance as of
January 1, 2012:
Cost 5,857 1,437 369 7,663
Amortization/
impairments (2,593) (793) (281) (3,667)
Book value 3,264 644 88 3,996
Changes in
book value:
Additions 11 347 29 387
Acquisitions
and purchase
price allocation
adjustments 137 − − 137
Amortization (455) (190) (44) (689)
Impairment
losses (17) (30) (2) (49)
Translation
differences (42) (10) − (52)
Other (2) 6 (3) 1
Total changes (368) 123 (20) (265)
Balance as of
December 31,
2012:
Cost 5,868 1,584 369 7,821
Amortization/
impairments (2,972) (817) (301) (4,090)
Book Value 2,896 767 68 3,731