Philips 2012 Annual Report Download - page 173
Download and view the complete annual report
Please find page 173 of the 2012 Philips annual report below. You can navigate through the pages in the report by either clicking on the pages listed below, or by using the keyword search tool below to find specific information within the annual report.-
 1
1 -
2
-
3
-
4
-
5
-
6
-
7
-
8
-
9
-
10
-
11
-
12
-
13
-
14
-
15
-
16
-
17
-
18
-
19
-
20
-
21
-
22
-
23
-
24
-
25
-
26
-
27
-
28
-
29
-
30
-
31
-
32
-
33
-
34
-
35
-
36
-
37
-
38
-
39
-
40
-
41
-
42
-
43
-
44
-
45
-
46
-
47
-
48
-
49
-
50
-
51
-
52
-
53
-
54
-
55
-
56
-
57
-
58
-
59
-
60
-
61
-
62
-
63
-
64
-
65
-
66
-
67
-
68
-
69
-
70
-
71
-
72
-
73
-
74
-
75
-
76
-
77
-
78
-
79
-
80
-
81
-
82
-
83
-
84
-
85
-
86
-
87
-
88
-
89
-
90
-
91
-
92
-
93
-
94
-
95
-
96
-
97
-
98
-
99
-
100
-
101
-
102
-
103
-
104
-
105
-
106
-
107
-
108
-
109
-
110
-
111
-
112
-
113
-
114
-
115
-
116
-
117
-
118
-
119
-
120
-
121
-
122
-
123
-
124
-
125
-
126
-
127
-
128
-
129
-
130
-
131
-
132
-
133
-
134
-
135
-
136
-
137
-
138
-
139
-
140
-
141
-
142
-
143
-
144
-
145
-
146
-
147
-
148
-
149
-
150
-
151
-
152
-
153
-
154
-
155
-
156
-
157
-
158
-
159
-
160
-
161
-
162
-
 163
163 -
 164
164 -
 165
165 -
 166
166 -
 167
167 -
 168
168 -
 169
169 -
 170
170 -
 171
171 -
 172
172 -
 173
173 -
 174
174 -
 175
175 -
 176
176 -
 177
177 -
 178
178 -
 179
179 -
 180
180 -
 181
181 -
 182
182 -
 183
183 -
184
-
185
-
186
-
187
-
188
-
189
-
190
-
191
-
192
-
193
-
194
-
195
-
196
-
197
-
198
-
199
-
200
-
201
-
202
-
203
-
204
-
205
-
206
-
207
-
208
-
209
-
210
-
211
-
212
-
213
-
214
-
215
-
216
-
217
-
218
-
219
-
220
-
221
-
222
-
223
-
224
-
225
-
226
-
227
-
228
-
229
-
230
-
231
 |
 |

12 Group financial statements 12.11 - 12.11 33
Annual Report 2012 173
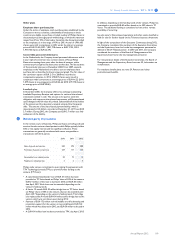
The individual members of the Supervisory Board received, by virtue of the positions they held, the following remuneration (in euros):
membership committees other compensation1) total
2012
J. van der Veer 110,000 20,500 5,000 135,500
J.M. Thompson (Jan. - Apr.) 32,500 4,667 11,000 48,167
C.J.A. van Lede 65,000 10,834 5,000 80,834
E. Kist 65,000 10,333 5,000 80,333
J.J. Schiro 65,000 17,000 17,000 99,000
H. von Prondzynski 65,000 10,000 5,000 80,000
C. Poon 65,000 12,666 14,000 91,666
J.P. Tai 65,000 13,333 17,000 95,333
N. Dhawan (Apr. - Dec.) 65,000 6,667 17,000 88,667
597,500 106,000 96,000 799,500
2011
J. van der Veer 98,750 19,375 2,000 120,125
J-M. Hessels (Jan. - March) 55,000 5,125 2,000 62,125
J.M. Thompson 65,000 14,000 20,000 99,000
C.J.A. van Lede 65,000 12,500 2,000 79,500
E. Kist 65,000 15,000 2,000 82,000
J.J. Schiro 65,000 14,000 17,000 96,000
H. von Prondzynski 65,000 10,000 2,000 77,000
C. Poon 65,000 10,000 20,000 95,000
J.P. Tai (Apr. - Dec.) 65,000 7,500 20,000 92,500
608,750 107,500 87,000 803,250
2010
J.-M.Hessels 110,000 20,500 5,000 135,500
J.M. Thompson 65,000 14,000 14,000 93,000
R. Greenbury (Jan. - March) 32,500 2,000 2,000 36,500
C.J.A. van Lede 65,000 12,500 5,000 82,500
E. Kist 65,000 15,000 5,000 85,000
J.J. Schiro 65,000 14,500 11,000 90,500
H. von Prondzynski 65,000 10,000 5,000 80,000
C. Poon 65,000 7,500 17,000 89,500
J. van der Veer 65,000 14,500 5,000 84,500
597,500 110,500 69,000 777,000
1) The amounts mentioned under other compensation relate to the fee for intercontinental travel and the entitlement of EUR 2,000 under the Philips product arrangement.
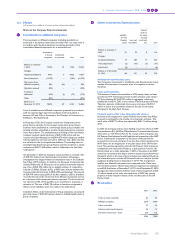
Supervisory Board members’ and Board of Management
members’ interests in Philips shares
Members of the Supervisory Board and of the Board of Management
are not allowed to hold any interests in derivative Philips securities.
Number of shares1)
December 31,
2011
December 31,
2012
J. van der Veer 15,781 16,624
H. von Prondzynski 3,124 3,290
J.P. Tai − 1,053
F.A. van Houten 11,700 21,048
R.H. Wirahadiraksa 8,030 16,060
P.A.J. Nota 3,400 11,757
1) Reference date for board membership is December 31, 2012
33 Fair value of financial assets and liabilities
The estimated fair value of financial instruments has been determined
by the Company using available market information and appropriate
valuation methods. The estimates presented are not necessarily
indicative of the amounts that will ultimately be realized by the
Company upon maturity or disposal. The use of different market
assumptions and/or estimation methods may have a material effect on
the estimated fair value amounts.
For cash and cash equivalents, current receivables, current payables,
interest accrual and short-term debts, the carrying amounts
approximate fair value, because of the short maturity of these
instruments.
The fair value of Philips’ debt is estimated on the basis of the quoted
market prices for certain issues, or on the basis of discounted cash flow
analysis based upon market rates plus Philips’ spread for the particular
tenors of the borrowing arrangement. Accrued interest is not within
the carrying amount or estimated fair value of debt.