RBS 2011 Annual Report Download - page 124
Download and view the complete annual report
Please find page 124 of the 2011 RBS annual report below. You can navigate through the pages in the report by either clicking on the pages listed below, or by using the keyword search tool below to find specific information within the annual report.-
 1
1 -
2
-
3
-
4
-
5
-
6
-
7
-
8
-
9
-
10
-
11
-
12
-
13
-
14
-
15
-
16
-
17
-
18
-
19
-
20
-
21
-
22
-
23
-
24
-
25
-
26
-
27
-
28
-
29
-
30
-
31
-
32
-
33
-
34
-
35
-
36
-
37
-
38
-
39
-
40
-
41
-
42
-
43
-
44
-
45
-
46
-
47
-
48
-
49
-
50
-
51
-
52
-
53
-
54
-
55
-
56
-
57
-
58
-
59
-
60
-
61
-
62
-
63
-
64
-
65
-
66
-
67
-
68
-
69
-
70
-
71
-
72
-
73
-
74
-
75
-
76
-
77
-
78
-
79
-
80
-
81
-
82
-
83
-
84
-
85
-
86
-
87
-
88
-
89
-
90
-
91
-
92
-
93
-
94
-
95
-
96
-
97
-
98
-
99
-
100
-
101
-
102
-
103
-
104
-
105
-
106
-
107
-
108
-
109
-
110
-
111
-
112
-
113
-
 114
114 -
 115
115 -
 116
116 -
 117
117 -
 118
118 -
 119
119 -
 120
120 -
 121
121 -
 122
122 -
 123
123 -
 124
124 -
 125
125 -
 126
126 -
 127
127 -
 128
128 -
 129
129 -
 130
130 -
 131
131 -
 132
132 -
 133
133 -
 134
134 -
135
-
136
-
137
-
138
-
139
-
140
-
141
-
142
-
143
-
144
-
145
-
146
-
147
-
148
-
149
-
150
-
151
-
152
-
153
-
154
-
155
-
156
-
157
-
158
-
159
-
160
-
161
-
162
-
163
-
164
-
165
-
166
-
167
-
168
-
169
-
170
-
171
-
172
-
173
-
174
-
175
-
176
-
177
-
178
-
179
-
180
-
181
-
182
-
183
-
184
-
185
-
186
-
187
-
188
-
189
-
190
-
191
-
192
-
193
-
194
-
195
-
196
-
197
-
198
-
199
-
200
-
201
-
202
-
203
-
204
-
205
-
206
-
207
-
208
-
209
-
210
-
211
-
212
-
213
-
214
-
215
-
216
-
217
-
218
-
219
-
220
-
221
-
222
-
223
-
224
-
225
-
226
-
227
-
228
-
229
-
230
-
231
-
232
-
233
-
234
-
235
-
236
-
237
-
238
-
239
-
240
-
241
-
242
-
243
-
244
-
245
-
246
-
247
-
248
-
249
-
250
-
251
-
252
-
253
-
254
-
255
-
256
-
257
-
258
-
259
-
260
-
261
-
262
-
263
-
264
-
265
-
266
-
267
-
268
-
269
-
270
-
271
-
272
-
273
-
274
-
275
-
276
-
277
-
278
-
279
-
280
-
281
-
282
-
283
-
284
-
285
-
286
-
287
-
288
-
289
-
290
-
291
-
292
-
293
-
294
-
295
-
296
-
297
-
298
-
299
-
300
-
301
-
302
-
303
-
304
-
305
-
306
-
307
-
308
-
309
-
310
-
311
-
312
-
313
-
314
-
315
-
316
-
317
-
318
-
319
-
320
-
321
-
322
-
323
-
324
-
325
-
326
-
327
-
328
-
329
-
330
-
331
-
332
-
333
-
334
-
335
-
336
-
337
-
338
-
339
-
340
-
341
-
342
-
343
-
344
-
345
-
346
-
347
-
348
-
349
-
350
-
351
-
352
-
353
-
354
-
355
-
356
-
357
-
358
-
359
-
360
-
361
-
362
-
363
-
364
-
365
-
366
-
367
-
368
-
369
-
370
-
371
-
372
-
373
-
374
-
375
-
376
-
377
-
378
-
379
-
380
-
381
-
382
-
383
-
384
-
385
-
386
-
387
-
388
-
389
-
390
-
391
-
392
-
393
-
394
-
395
-
396
-
397
-
398
-
399
-
400
-
401
-
402
-
403
-
404
-
405
-
406
-
407
-
408
-
409
-
410
-
411
-
412
-
413
-
414
-
415
-
416
-
417
-
418
-
419
-
420
-
421
-
422
-
423
-
424
-
425
-
426
-
427
-
428
-
429
-
430
-
431
-
432
-
433
-
434
-
435
-
436
-
437
-
438
-
439
-
440
-
441
-
442
-
443
-
444
-
445
-
446
-
447
-
448
-
449
-
450
-
451
-
452
-
453
-
454
-
455
-
456
-
457
-
458
-
459
-
460
-
461
-
462
-
463
-
464
-
465
-
466
-
467
-
468
-
469
-
470
-
471
-
472
-
473
-
474
-
475
-
476
-
477
-
478
-
479
-
480
-
481
-
482
-
483
-
484
-
485
-
486
-
487
-
488
-
489
-
490
 |
 |

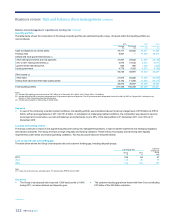
122 RBS Group 2011
Balance sheet management: Liquidity and funding risk continued
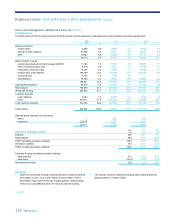
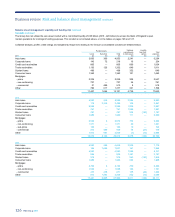
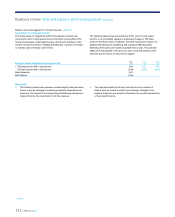
Liquidity portfolio
The table below shows the composition of the Group’s liquidity portfolio (at estimated liquidity value). All assets within the liquidity portfolio are
unencumbered.
2011 2010 2009
Average
£m
Period end
£m
Period end
£m
Period end
£m
Cash and balances at central banks 74,711 69,932 53,661 51,500
Treasury bills 5,937 — 14,529 30,010
Central and local government bonds (1)
-AAA rated governments and US agencies 37,947 29,632 41,435 30,140
-AA- to AA+ rated governments (2) 3,074 14,102 3,744 2,011
-governments rated below AA 925 955 1,029 1,630
-local government 4,779 4,302 5,672 5,706
46,725 48,991 51,880 39,487
Other assets (3)
-AAA rated 21,973 25,202 17,836 20,246
-below AAA rated and other high quality assets 12,102 11,205 16,693 29,418
34,075 36,407 34,529 49,664
Total liquidity portfolio 161,448 155,330 154,599 170,661
Notes:
(1) Includes FSA eligible government bonds of £36.7 billion at 31 December 2011 (2010 - £34.7 billion; 2009 - £19.9 billion).
(2) Includes AAA rated US government guaranteed and US government sponsored agencies. The US government was downgraded from AAA to AA+ by S&P on 5 August 2011, although not by
Moody’s or Fitch. These securities are reflected here.
(3) Includes assets eligible for discounting at central banks.
Key point
xIn view of the continuing uncertain market conditions, the liquidity portfolio was maintained above the Group’s target level of £150 billion at £155.3
billion, with an average balance in 2011 of £161.4 billion. In anticipation of challenging market conditions, the composition was altered to become
more liquid and conservative, as cash and balances at central banks rose to 45% of the total portfolio at 31 December 2011, from 35% at 31
December 2010.
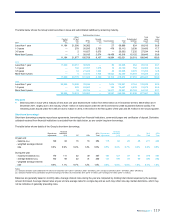
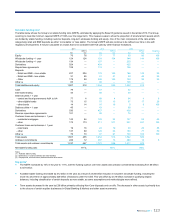
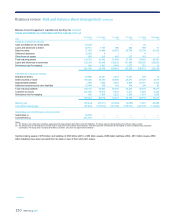
Liquidity and funding metrics
The Group continues to improve and augment liquidity and funding risk management practices, in light of market experience and emerging regulatory
and industry standards. The Group monitors a range of liquidity and funding indicators. These metrics encompass short and long-term liquidity
requirements under stress and normal operating conditions. Two key structural ratios are described below.
Loan to deposit ratio and funding gap
The table belowshows the Group’s loan:deposit ratio and customer funding gap, including disposal groups.
Loan:deposit ratio
Group
%
Core
%
Customer
funding gap
Group
£bn
2011 108 94 37
2010 118 96 77
2009 132 103 137
Note:
(1) Loans are net of provisions, excluding repos. For Group before RFS MI only for 2009.
Key points
xThe Group’s loan:deposit ratio improved 1,000 basis points to 108%
during 2011, as loans declined and deposits grew.
xThe customer funding gap almost halved with Non-Core contributing
£27 billion of the £40 billion reduction.
*unaudited
Business review Risk and balance sheet management continued