RBS 2011 Annual Report Download - page 160
Download and view the complete annual report
Please find page 160 of the 2011 RBS annual report below. You can navigate through the pages in the report by either clicking on the pages listed below, or by using the keyword search tool below to find specific information within the annual report.-
 1
1 -
2
-
3
-
4
-
5
-
6
-
7
-
8
-
9
-
10
-
11
-
12
-
13
-
14
-
15
-
16
-
17
-
18
-
19
-
20
-
21
-
22
-
23
-
24
-
25
-
26
-
27
-
28
-
29
-
30
-
31
-
32
-
33
-
34
-
35
-
36
-
37
-
38
-
39
-
40
-
41
-
42
-
43
-
44
-
45
-
46
-
47
-
48
-
49
-
50
-
51
-
52
-
53
-
54
-
55
-
56
-
57
-
58
-
59
-
60
-
61
-
62
-
63
-
64
-
65
-
66
-
67
-
68
-
69
-
70
-
71
-
72
-
73
-
74
-
75
-
76
-
77
-
78
-
79
-
80
-
81
-
82
-
83
-
84
-
85
-
86
-
87
-
88
-
89
-
90
-
91
-
92
-
93
-
94
-
95
-
96
-
97
-
98
-
99
-
100
-
101
-
102
-
103
-
104
-
105
-
106
-
107
-
108
-
109
-
110
-
111
-
112
-
113
-
114
-
115
-
116
-
117
-
118
-
119
-
120
-
121
-
122
-
123
-
124
-
125
-
126
-
127
-
128
-
129
-
130
-
131
-
132
-
133
-
134
-
135
-
136
-
137
-
138
-
139
-
140
-
141
-
142
-
143
-
144
-
145
-
146
-
147
-
148
-
149
-
 150
150 -
 151
151 -
 152
152 -
 153
153 -
 154
154 -
 155
155 -
 156
156 -
 157
157 -
 158
158 -
 159
159 -
 160
160 -
 161
161 -
 162
162 -
 163
163 -
 164
164 -
 165
165 -
 166
166 -
 167
167 -
 168
168 -
 169
169 -
 170
170 -
171
-
172
-
173
-
174
-
175
-
176
-
177
-
178
-
179
-
180
-
181
-
182
-
183
-
184
-
185
-
186
-
187
-
188
-
189
-
190
-
191
-
192
-
193
-
194
-
195
-
196
-
197
-
198
-
199
-
200
-
201
-
202
-
203
-
204
-
205
-
206
-
207
-
208
-
209
-
210
-
211
-
212
-
213
-
214
-
215
-
216
-
217
-
218
-
219
-
220
-
221
-
222
-
223
-
224
-
225
-
226
-
227
-
228
-
229
-
230
-
231
-
232
-
233
-
234
-
235
-
236
-
237
-
238
-
239
-
240
-
241
-
242
-
243
-
244
-
245
-
246
-
247
-
248
-
249
-
250
-
251
-
252
-
253
-
254
-
255
-
256
-
257
-
258
-
259
-
260
-
261
-
262
-
263
-
264
-
265
-
266
-
267
-
268
-
269
-
270
-
271
-
272
-
273
-
274
-
275
-
276
-
277
-
278
-
279
-
280
-
281
-
282
-
283
-
284
-
285
-
286
-
287
-
288
-
289
-
290
-
291
-
292
-
293
-
294
-
295
-
296
-
297
-
298
-
299
-
300
-
301
-
302
-
303
-
304
-
305
-
306
-
307
-
308
-
309
-
310
-
311
-
312
-
313
-
314
-
315
-
316
-
317
-
318
-
319
-
320
-
321
-
322
-
323
-
324
-
325
-
326
-
327
-
328
-
329
-
330
-
331
-
332
-
333
-
334
-
335
-
336
-
337
-
338
-
339
-
340
-
341
-
342
-
343
-
344
-
345
-
346
-
347
-
348
-
349
-
350
-
351
-
352
-
353
-
354
-
355
-
356
-
357
-
358
-
359
-
360
-
361
-
362
-
363
-
364
-
365
-
366
-
367
-
368
-
369
-
370
-
371
-
372
-
373
-
374
-
375
-
376
-
377
-
378
-
379
-
380
-
381
-
382
-
383
-
384
-
385
-
386
-
387
-
388
-
389
-
390
-
391
-
392
-
393
-
394
-
395
-
396
-
397
-
398
-
399
-
400
-
401
-
402
-
403
-
404
-
405
-
406
-
407
-
408
-
409
-
410
-
411
-
412
-
413
-
414
-
415
-
416
-
417
-
418
-
419
-
420
-
421
-
422
-
423
-
424
-
425
-
426
-
427
-
428
-
429
-
430
-
431
-
432
-
433
-
434
-
435
-
436
-
437
-
438
-
439
-
440
-
441
-
442
-
443
-
444
-
445
-
446
-
447
-
448
-
449
-
450
-
451
-
452
-
453
-
454
-
455
-
456
-
457
-
458
-
459
-
460
-
461
-
462
-
463
-
464
-
465
-
466
-
467
-
468
-
469
-
470
-
471
-
472
-
473
-
474
-
475
-
476
-
477
-
478
-
479
-
480
-
481
-
482
-
483
-
484
-
485
-
486
-
487
-
488
-
489
-
490
 |
 |

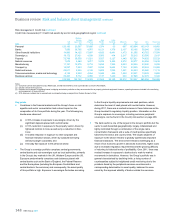
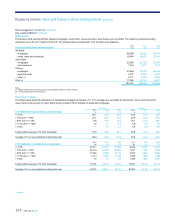
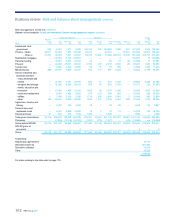
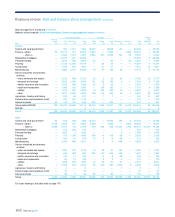
158 RBS Group 2011
Risk management: Credit risk continued
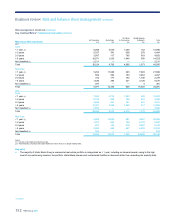
Key credit portfolios*: Ulster Bank Group (Core and Non-Core) continued
Gross
loans REIL Provisions
REIL
as a % of
gross loans
Provisions
as a % of
REIL
Provisions
as a % of
gross loans
Impairment
charge
Amounts
written-off
2010 £m £m £m % % % £m £m
Core
Mortgages 21,162 1,566 439 7.4 28 2.1 294 7
Personal unsecured 1,282 185 158 14.4 85 12.3 48 30
Commercial real estate
- investment 4,284 598 332 14.0 56 7.7 259 —
- development 1,090 65 37 6.0 57 3.4 116 —
Other corporate 9,039 1,205 667 13.3 55 7.4 444 11
36,857 3,619 1,633 9.8 45 4.4 1,161 48
Non-Core
Mortgages — — — — — — 42 —
Commercial real estate
- investment 3,854 2,391 1,000 62.0 42 25.9 630 —
- development 8,760 6,341 2,783 72.4 44 31.8 1,759 —
Other corporate 1,970 1,310 561 66.5 43 28.5 251 —
14,584 10,042 4,344 68.9 43 29.8 2,682 —
Ulster Bank Group
Mortgages 21,162 1,566 439 7.4 28 2.1 336 7
Personal unsecured 1,282 185 158 14.4 85 12.3 48 30
Commercial real estate
- investment 8,138 2,989 1,332 36.7 45 16.4 889 —
- development 9,850 6,406 2,820 65.0 44 28.6 1,875 —
Other corporate 11,009 2,515 1,228 22.8 49 11.2 695 11
51,441 13,661 5,977 26.6 44 11.6 3,843 48
2009
Core
Mortgages 16,199 558 102 3.4 18 0.6 74 3
Personal unsecured 2,433 174 145 7.2 83 6.0 66 27
Commercial real estate
- investment 6,131 250 105 4.1 42 1.7 84 —
- development 3,838 428 284 11.2 66 7.4 221 4
Other corporate 11,106 850 326 7.7 38 2.9 204 —
39,707 2,260 962 5.7 43 2.4 649 34
Non-Core
Mortgages 6,002 324 51 5.4 16 0.8 42 —
Commercial real estate
- investment 2,061 1,498 308 72.7 21 14.9 286 —
- development 6,271 3,840 822 61.2 21 13.1 732 —
Other corporate 1,373 1,126 322 82.0 29 23.5 217 —
15,707 6,788 1,503 43.2 22 9.6 1,277 —
Ulster Bank Group
Mortgages 22,201 882 153 4.0 17 0.7 116 3
Personal unsecured 2,433 174 145 7.2 83 6.0 66 27
Commercial real estate
- investment 8,192 1,748 413 21.3 24 5.0 370 —
- development 10,109 4,268 1,106 42.2 26 10.9 953 4
Other corporate 12,479 1,976 648 15.8 33 5.2 421 —
55,414 9,048 2,465 16.3 27 4.4 1,926 34
*unaudited
Business review Risk and balance sheet management continued