RBS 2011 Annual Report Download - page 234
Download and view the complete annual report
Please find page 234 of the 2011 RBS annual report below. You can navigate through the pages in the report by either clicking on the pages listed below, or by using the keyword search tool below to find specific information within the annual report.-
 1
1 -
2
-
3
-
4
-
5
-
6
-
7
-
8
-
9
-
10
-
11
-
12
-
13
-
14
-
15
-
16
-
17
-
18
-
19
-
20
-
21
-
22
-
23
-
24
-
25
-
26
-
27
-
28
-
29
-
30
-
31
-
32
-
33
-
34
-
35
-
36
-
37
-
38
-
39
-
40
-
41
-
42
-
43
-
44
-
45
-
46
-
47
-
48
-
49
-
50
-
51
-
52
-
53
-
54
-
55
-
56
-
57
-
58
-
59
-
60
-
61
-
62
-
63
-
64
-
65
-
66
-
67
-
68
-
69
-
70
-
71
-
72
-
73
-
74
-
75
-
76
-
77
-
78
-
79
-
80
-
81
-
82
-
83
-
84
-
85
-
86
-
87
-
88
-
89
-
90
-
91
-
92
-
93
-
94
-
95
-
96
-
97
-
98
-
99
-
100
-
101
-
102
-
103
-
104
-
105
-
106
-
107
-
108
-
109
-
110
-
111
-
112
-
113
-
114
-
115
-
116
-
117
-
118
-
119
-
120
-
121
-
122
-
123
-
124
-
125
-
126
-
127
-
128
-
129
-
130
-
131
-
132
-
133
-
134
-
135
-
136
-
137
-
138
-
139
-
140
-
141
-
142
-
143
-
144
-
145
-
146
-
147
-
148
-
149
-
150
-
151
-
152
-
153
-
154
-
155
-
156
-
157
-
158
-
159
-
160
-
161
-
162
-
163
-
164
-
165
-
166
-
167
-
168
-
169
-
170
-
171
-
172
-
173
-
174
-
175
-
176
-
177
-
178
-
179
-
180
-
181
-
182
-
183
-
184
-
185
-
186
-
187
-
188
-
189
-
190
-
191
-
192
-
193
-
194
-
195
-
196
-
197
-
198
-
199
-
200
-
201
-
202
-
203
-
204
-
205
-
206
-
207
-
208
-
209
-
210
-
211
-
212
-
213
-
214
-
215
-
216
-
217
-
218
-
219
-
220
-
221
-
222
-
223
-
 224
224 -
 225
225 -
 226
226 -
 227
227 -
 228
228 -
 229
229 -
 230
230 -
 231
231 -
 232
232 -
 233
233 -
 234
234 -
 235
235 -
 236
236 -
 237
237 -
 238
238 -
 239
239 -
 240
240 -
 241
241 -
 242
242 -
 243
243 -
 244
244 -
245
-
246
-
247
-
248
-
249
-
250
-
251
-
252
-
253
-
254
-
255
-
256
-
257
-
258
-
259
-
260
-
261
-
262
-
263
-
264
-
265
-
266
-
267
-
268
-
269
-
270
-
271
-
272
-
273
-
274
-
275
-
276
-
277
-
278
-
279
-
280
-
281
-
282
-
283
-
284
-
285
-
286
-
287
-
288
-
289
-
290
-
291
-
292
-
293
-
294
-
295
-
296
-
297
-
298
-
299
-
300
-
301
-
302
-
303
-
304
-
305
-
306
-
307
-
308
-
309
-
310
-
311
-
312
-
313
-
314
-
315
-
316
-
317
-
318
-
319
-
320
-
321
-
322
-
323
-
324
-
325
-
326
-
327
-
328
-
329
-
330
-
331
-
332
-
333
-
334
-
335
-
336
-
337
-
338
-
339
-
340
-
341
-
342
-
343
-
344
-
345
-
346
-
347
-
348
-
349
-
350
-
351
-
352
-
353
-
354
-
355
-
356
-
357
-
358
-
359
-
360
-
361
-
362
-
363
-
364
-
365
-
366
-
367
-
368
-
369
-
370
-
371
-
372
-
373
-
374
-
375
-
376
-
377
-
378
-
379
-
380
-
381
-
382
-
383
-
384
-
385
-
386
-
387
-
388
-
389
-
390
-
391
-
392
-
393
-
394
-
395
-
396
-
397
-
398
-
399
-
400
-
401
-
402
-
403
-
404
-
405
-
406
-
407
-
408
-
409
-
410
-
411
-
412
-
413
-
414
-
415
-
416
-
417
-
418
-
419
-
420
-
421
-
422
-
423
-
424
-
425
-
426
-
427
-
428
-
429
-
430
-
431
-
432
-
433
-
434
-
435
-
436
-
437
-
438
-
439
-
440
-
441
-
442
-
443
-
444
-
445
-
446
-
447
-
448
-
449
-
450
-
451
-
452
-
453
-
454
-
455
-
456
-
457
-
458
-
459
-
460
-
461
-
462
-
463
-
464
-
465
-
466
-
467
-
468
-
469
-
470
-
471
-
472
-
473
-
474
-
475
-
476
-
477
-
478
-
479
-
480
-
481
-
482
-
483
-
484
-
485
-
486
-
487
-
488
-
489
-
490
 |
 |

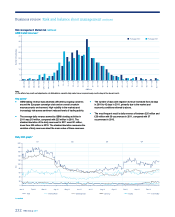
232 RBS Group 2011
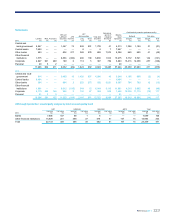
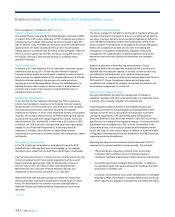
Risk management: Market risk continued Risk management: Market risk continued
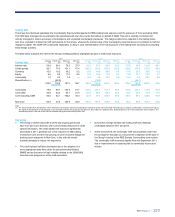
GBM traded revenues* GBM traded revenues*
0
5
10
15
20
25
30
35
40
(40)< (35)
(35) < (30)
(30) < (25)
(25) < (20)
(20) > < (15)
(15) >< (10)
(10) > < (5)
(5) > < 0
0 > < 5
5 > <10
10 >< 15
15 > <20
20 > < 25
25 > < 30
30 > < 35
35 > <40
40 >< 45
45 > < 50
50 > < 55
55 > <60
60 >< 65
65 > < 70
70 > < 75
75 > < 80
80 >< 85
85 > < 90
90 > < 95
95 > < 100
GBP £ m
Number of trading days
2010 2011
Note: Note:
(1) The effect of any month end adjustments, not attributable to a specific daily market move, is spread evenly over the days of the relevant month. (1) The effect of any month end adjustments, not attributable to a specific daily market move, is spread evenly over the days of the relevant month.
Key points* Key points*
xGBM trading revenue was adversely affected by ongoing concerns
around the European sovereign crisis and an overall uncertain
macroeconomic environment. High volatility in the markets and
increasingly risk-averse sentiment reduced levels of trading activity.
xGBM trading revenue was adversely affected by ongoing concerns
around the European sovereign crisis and an overall uncertain
macroeconomic environment. High volatility in the markets and
increasingly risk-averse sentiment reduced levels of trading activity.
xThe average daily revenue earned by GBM’s trading activities in
2011 was £19 million, compared with £25 million in 2010. The
standard deviation of the daily revenues for 2011 was £21 million,
down from £22 million in 2010. The standard deviation measures the
variation of daily revenues about the mean value of those revenues.
xThe number of days with negative revenue increased from 22 days
in 2010 to 42 days in 2011, primarily due to the market and
economic conditions referred to above.
xThe number of days with negative revenue increased from 22 days
in 2010 to 42 days in 2011, primarily due to the market and
economic conditions referred to above.
xThe most frequent result is daily revenue of between £25 million and
£30 million with 30 occurrences in 2011, compared with 37
occurrences in 2010.
xThe most frequent result is daily revenue of between £25 million and
£30 million with 30 occurrences in 2011, compared with 37
occurrences in 2010.
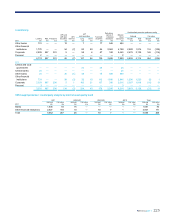
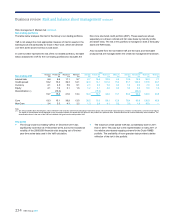
Daily VaR graph* Daily VaR graph*
0
20
40
60
80
100
120
140
160
180
200
January February March April May June July August September October November December
£m
Total Interest Rate Credit Spread Currency Equity Commodity
*unaudited *unaudited
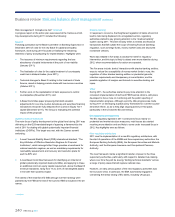
Business review Risk and balance sheet management continued
0
5
10
15
20
25
30
35
40
Number of trading days
GBP £m
Full year 2010 Full year 2011
(40) < (35)
(35) < (30)
(30) < (25)
(25) < (20)
(20) > < (15)
(15) > < (10)
(10) > < (5)
(5) > < 0
0 > < 5
5 > < 10
10 > < 15
15 > < 20
20 > < 25
25 > < 30
30 > < 35
35 > < 40
40 > < 45
45 > < 50
50 > < 55
55 > < 60
60 > < 65
65 > < 70
70 > < 75
75 > < 80
80 > < 85
85 > < 90
90 > < 95
95 > < 100
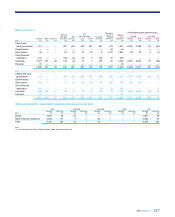
0
20
40
60
80
100
120
140
160
180
200
Jan-11 Feb-11 Mar-11 Apr-11 May-11 Jun-11 Jul-11 Aug-11 Sep-11 Oct-11 Nov-11 Dec-11
£m
Total Interest Rate Credit Spread Currency Equity Commodity
Q1 Q2 Q3 Q4