RBS 2011 Annual Report Download - page 352
Download and view the complete annual report
Please find page 352 of the 2011 RBS annual report below. You can navigate through the pages in the report by either clicking on the pages listed below, or by using the keyword search tool below to find specific information within the annual report.-
 1
1 -
2
-
3
-
4
-
5
-
6
-
7
-
8
-
9
-
10
-
11
-
12
-
13
-
14
-
15
-
16
-
17
-
18
-
19
-
20
-
21
-
22
-
23
-
24
-
25
-
26
-
27
-
28
-
29
-
30
-
31
-
32
-
33
-
34
-
35
-
36
-
37
-
38
-
39
-
40
-
41
-
42
-
43
-
44
-
45
-
46
-
47
-
48
-
49
-
50
-
51
-
52
-
53
-
54
-
55
-
56
-
57
-
58
-
59
-
60
-
61
-
62
-
63
-
64
-
65
-
66
-
67
-
68
-
69
-
70
-
71
-
72
-
73
-
74
-
75
-
76
-
77
-
78
-
79
-
80
-
81
-
82
-
83
-
84
-
85
-
86
-
87
-
88
-
89
-
90
-
91
-
92
-
93
-
94
-
95
-
96
-
97
-
98
-
99
-
100
-
101
-
102
-
103
-
104
-
105
-
106
-
107
-
108
-
109
-
110
-
111
-
112
-
113
-
114
-
115
-
116
-
117
-
118
-
119
-
120
-
121
-
122
-
123
-
124
-
125
-
126
-
127
-
128
-
129
-
130
-
131
-
132
-
133
-
134
-
135
-
136
-
137
-
138
-
139
-
140
-
141
-
142
-
143
-
144
-
145
-
146
-
147
-
148
-
149
-
150
-
151
-
152
-
153
-
154
-
155
-
156
-
157
-
158
-
159
-
160
-
161
-
162
-
163
-
164
-
165
-
166
-
167
-
168
-
169
-
170
-
171
-
172
-
173
-
174
-
175
-
176
-
177
-
178
-
179
-
180
-
181
-
182
-
183
-
184
-
185
-
186
-
187
-
188
-
189
-
190
-
191
-
192
-
193
-
194
-
195
-
196
-
197
-
198
-
199
-
200
-
201
-
202
-
203
-
204
-
205
-
206
-
207
-
208
-
209
-
210
-
211
-
212
-
213
-
214
-
215
-
216
-
217
-
218
-
219
-
220
-
221
-
222
-
223
-
224
-
225
-
226
-
227
-
228
-
229
-
230
-
231
-
232
-
233
-
234
-
235
-
236
-
237
-
238
-
239
-
240
-
241
-
242
-
243
-
244
-
245
-
246
-
247
-
248
-
249
-
250
-
251
-
252
-
253
-
254
-
255
-
256
-
257
-
258
-
259
-
260
-
261
-
262
-
263
-
264
-
265
-
266
-
267
-
268
-
269
-
270
-
271
-
272
-
273
-
274
-
275
-
276
-
277
-
278
-
279
-
280
-
281
-
282
-
283
-
284
-
285
-
286
-
287
-
288
-
289
-
290
-
291
-
292
-
293
-
294
-
295
-
296
-
297
-
298
-
299
-
300
-
301
-
302
-
303
-
304
-
305
-
306
-
307
-
308
-
309
-
310
-
311
-
312
-
313
-
314
-
315
-
316
-
317
-
318
-
319
-
320
-
321
-
322
-
323
-
324
-
325
-
326
-
327
-
328
-
329
-
330
-
331
-
332
-
333
-
334
-
335
-
336
-
337
-
338
-
339
-
340
-
341
-
 342
342 -
 343
343 -
 344
344 -
 345
345 -
 346
346 -
 347
347 -
 348
348 -
 349
349 -
 350
350 -
 351
351 -
 352
352 -
 353
353 -
 354
354 -
 355
355 -
 356
356 -
 357
357 -
 358
358 -
 359
359 -
 360
360 -
 361
361 -
 362
362 -
363
-
364
-
365
-
366
-
367
-
368
-
369
-
370
-
371
-
372
-
373
-
374
-
375
-
376
-
377
-
378
-
379
-
380
-
381
-
382
-
383
-
384
-
385
-
386
-
387
-
388
-
389
-
390
-
391
-
392
-
393
-
394
-
395
-
396
-
397
-
398
-
399
-
400
-
401
-
402
-
403
-
404
-
405
-
406
-
407
-
408
-
409
-
410
-
411
-
412
-
413
-
414
-
415
-
416
-
417
-
418
-
419
-
420
-
421
-
422
-
423
-
424
-
425
-
426
-
427
-
428
-
429
-
430
-
431
-
432
-
433
-
434
-
435
-
436
-
437
-
438
-
439
-
440
-
441
-
442
-
443
-
444
-
445
-
446
-
447
-
448
-
449
-
450
-
451
-
452
-
453
-
454
-
455
-
456
-
457
-
458
-
459
-
460
-
461
-
462
-
463
-
464
-
465
-
466
-
467
-
468
-
469
-
470
-
471
-
472
-
473
-
474
-
475
-
476
-
477
-
478
-
479
-
480
-
481
-
482
-
483
-
484
-
485
-
486
-
487
-
488
-
489
-
490
 |
 |

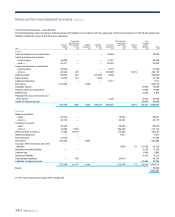
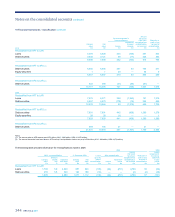
350 RBS Group 2011
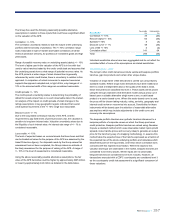
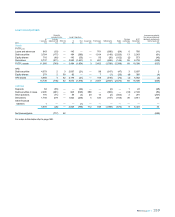
11 Financial instruments - valuation continued
Valuation hierarchy
The following tables show financial instruments carried at fair value on the Group’s balance sheet by valuation hierarchy - level 1, level 2 and level 3.
2011 2010 2009
Level 1
£bn
Level 2
£bn
Level 3
£bn
Total
£bn
Level 1
£bn
Level 2
£bn
Level 3
£bn
Total
£bn Level 1
£bn
Level 2
£bn
Level 3
£bn
Total
£bn
Assets
Loans and advances to banks
Reverse repos — 34.7 — 34.7 —38.2 — 38.2 — 26.9 — 26.9
Collateral — 19.7 — 19.7 —25.1 — 25.1 — 18.4 — 18.4
Other — 0.2 0.4 0.6 —0.6 0.4 1.0 — 0.1 — 0.1
— 54.6 0.4 55.0 —63.9 0.4 64.3 — 45.4 — 45.4
Loans and advances to customers
Reverse repos — 53.6 — 53.6 —41.1 — 41.1 — 26.3 — 26.3
Collateral — 22.0 — 22.0 —14.4 — 14.4 — 9.6 — 9.6
Other — 3.4 0.4 3.8 —6.2 0.4 6.6 — 7.3 1.1 8.4
—
79.0 0.4 79.4
—
61.7 0.4 62.1 — 43.2 1.1 44.3
Debt securities
UK government 22.4 — — 22.4 13.5 — — 13.5 27.3 — — 27.3
US government 35.5 5.0 — 40.5 31.0 7.0 — 38.0 19.2 9.2 — 28.4
Other government 53.9 8.7 — 62.6 62.3 13.6 — 75.9 79.6 16.3 — 95.9
Corporate — 5.0 0.5 5.5 — 6.5 1.2 7.7 — 9.2 1.2 10.4
Financial institutions 3.0 61.6 7.4 72.0 3.5 64.8 7.0 75.3 4.2 88.3 2.9 95.4
114.8 80.3 7.9 203.0 110.3 91.9 8.2 210.4 130.3 123.0 4.1 257.4
Equity shares 12.4 1.8 1.0 15.2 18.4 2.8 1.0 22.2 15.4 2.6 1.5 19.5
Derivatives
Foreign exchange — 72.9 1.6 74.5 —83.2 0.1 83.3 — 69.2 0.2 69.4
Interest rate 0.2 420.8 1.1 422.1 1.7 308.3 1.7 311.7 0.3 321.8 1.5 323.6
Equities and commodities — 5.9 0.2 6.1 0.1 4.9 0.2 5.2 0.4 6.1 0.3 6.8
Credit - APS — — — — — — 0.6 0.6 — — 1.4 1.4
Credit - other — 23.1 3.8 26.9 — 23.2 3.1 26.3 0.1 37.2 3.0 40.3
0.2 522.7 6.7 529.6 1.8 419.6 5.7 427.1 0.8 434.3 6.4 441.5
127.4 738.4 16.4 882.2 130.5 639.9 15.7 786.1 146.5 648.5 13.1 808.1
Of which
Core 126.9 724.5 7.2 858.6 129.4 617.6 7.2 754.2
Non-Core 0.5 13.9 9.2 23.6 1.1 22.3 8.5 31.9
127.4 738.4 16.4 882.2 130.5 639.9 15.7 786.1
Proportion 14.4% 83.7% 1.9% 100.0% 16.6% 81.4% 2.0% 100.0% 18.1% 80.3% 1.6% 100.0%
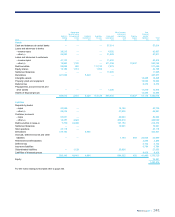
Of which AFS debt securities
UK government 13.4 — — 13.4 8.4 — — 8.4 19.1 — — 19.1
US government 18.1 2.7 — 20.8 17.8 4.4 — 22.2 12.6 6.4 — 19.0
Other government 21.6 4.0 — 25.6 26.5 6.4 — 32.9 38.4 7.1 — 45.5
Corporate — 2.3 0.2 2.5 — 1.4 0.1 1.5 — 3.3 0.2 3.5
Financial institutions 0.2 39.3 5.5 45.0 0.4 41.4 4.3 46.1 0.2 54.9 1.1 56.2
53.3 48.3 5.7 107.3 53.1 53.6 4.4 111.1 70.3 71.7 1.3 143.3
Equity shares 0.3 1.3 0.4 2.0 0.3 1.4 0.3 2.0 0.5 1.7 0.7 2.9
Total AFS assets 53.6 49.6 6.1 109.3 53.4 55.0 4.7 113.1 70.8 73.4 2.0 146.2
Of which
Core 53.6 46.9 0.6 101.1 52.8 49.2 1.0 103.0
Non-Core — 2.7 5.5 8.2 0.6 5.8 3.7 10.1
53.6 49.6 6.1 109.3 53.4 55.0 4.7 113.1
For notes relating to this table refer to page 351.
Notes on the consolidated accounts continued