RBS 2011 Annual Report Download - page 44
Download and view the complete annual report
Please find page 44 of the 2011 RBS annual report below. You can navigate through the pages in the report by either clicking on the pages listed below, or by using the keyword search tool below to find specific information within the annual report.-
 1
1 -
2
-
3
-
4
-
5
-
6
-
7
-
8
-
9
-
10
-
11
-
12
-
13
-
14
-
15
-
16
-
17
-
18
-
19
-
20
-
21
-
22
-
23
-
24
-
25
-
26
-
27
-
28
-
29
-
30
-
31
-
32
-
33
-
 34
34 -
 35
35 -
 36
36 -
 37
37 -
 38
38 -
 39
39 -
 40
40 -
 41
41 -
 42
42 -
 43
43 -
 44
44 -
 45
45 -
 46
46 -
 47
47 -
 48
48 -
 49
49 -
 50
50 -
 51
51 -
 52
52 -
 53
53 -
 54
54 -
55
-
56
-
57
-
58
-
59
-
60
-
61
-
62
-
63
-
64
-
65
-
66
-
67
-
68
-
69
-
70
-
71
-
72
-
73
-
74
-
75
-
76
-
77
-
78
-
79
-
80
-
81
-
82
-
83
-
84
-
85
-
86
-
87
-
88
-
89
-
90
-
91
-
92
-
93
-
94
-
95
-
96
-
97
-
98
-
99
-
100
-
101
-
102
-
103
-
104
-
105
-
106
-
107
-
108
-
109
-
110
-
111
-
112
-
113
-
114
-
115
-
116
-
117
-
118
-
119
-
120
-
121
-
122
-
123
-
124
-
125
-
126
-
127
-
128
-
129
-
130
-
131
-
132
-
133
-
134
-
135
-
136
-
137
-
138
-
139
-
140
-
141
-
142
-
143
-
144
-
145
-
146
-
147
-
148
-
149
-
150
-
151
-
152
-
153
-
154
-
155
-
156
-
157
-
158
-
159
-
160
-
161
-
162
-
163
-
164
-
165
-
166
-
167
-
168
-
169
-
170
-
171
-
172
-
173
-
174
-
175
-
176
-
177
-
178
-
179
-
180
-
181
-
182
-
183
-
184
-
185
-
186
-
187
-
188
-
189
-
190
-
191
-
192
-
193
-
194
-
195
-
196
-
197
-
198
-
199
-
200
-
201
-
202
-
203
-
204
-
205
-
206
-
207
-
208
-
209
-
210
-
211
-
212
-
213
-
214
-
215
-
216
-
217
-
218
-
219
-
220
-
221
-
222
-
223
-
224
-
225
-
226
-
227
-
228
-
229
-
230
-
231
-
232
-
233
-
234
-
235
-
236
-
237
-
238
-
239
-
240
-
241
-
242
-
243
-
244
-
245
-
246
-
247
-
248
-
249
-
250
-
251
-
252
-
253
-
254
-
255
-
256
-
257
-
258
-
259
-
260
-
261
-
262
-
263
-
264
-
265
-
266
-
267
-
268
-
269
-
270
-
271
-
272
-
273
-
274
-
275
-
276
-
277
-
278
-
279
-
280
-
281
-
282
-
283
-
284
-
285
-
286
-
287
-
288
-
289
-
290
-
291
-
292
-
293
-
294
-
295
-
296
-
297
-
298
-
299
-
300
-
301
-
302
-
303
-
304
-
305
-
306
-
307
-
308
-
309
-
310
-
311
-
312
-
313
-
314
-
315
-
316
-
317
-
318
-
319
-
320
-
321
-
322
-
323
-
324
-
325
-
326
-
327
-
328
-
329
-
330
-
331
-
332
-
333
-
334
-
335
-
336
-
337
-
338
-
339
-
340
-
341
-
342
-
343
-
344
-
345
-
346
-
347
-
348
-
349
-
350
-
351
-
352
-
353
-
354
-
355
-
356
-
357
-
358
-
359
-
360
-
361
-
362
-
363
-
364
-
365
-
366
-
367
-
368
-
369
-
370
-
371
-
372
-
373
-
374
-
375
-
376
-
377
-
378
-
379
-
380
-
381
-
382
-
383
-
384
-
385
-
386
-
387
-
388
-
389
-
390
-
391
-
392
-
393
-
394
-
395
-
396
-
397
-
398
-
399
-
400
-
401
-
402
-
403
-
404
-
405
-
406
-
407
-
408
-
409
-
410
-
411
-
412
-
413
-
414
-
415
-
416
-
417
-
418
-
419
-
420
-
421
-
422
-
423
-
424
-
425
-
426
-
427
-
428
-
429
-
430
-
431
-
432
-
433
-
434
-
435
-
436
-
437
-
438
-
439
-
440
-
441
-
442
-
443
-
444
-
445
-
446
-
447
-
448
-
449
-
450
-
451
-
452
-
453
-
454
-
455
-
456
-
457
-
458
-
459
-
460
-
461
-
462
-
463
-
464
-
465
-
466
-
467
-
468
-
469
-
470
-
471
-
472
-
473
-
474
-
475
-
476
-
477
-
478
-
479
-
480
-
481
-
482
-
483
-
484
-
485
-
486
-
487
-
488
-
489
-
490
 |
 |

42 RBS Group 2011
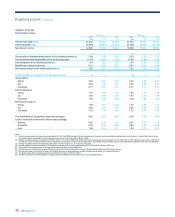
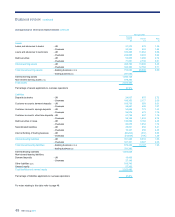
Summary consolidated income statement
for the year ended 31 December 2011 continued
Managed Statutory
2011 2010 2009 2011 2010 2009
£m £m £m £m £m £m
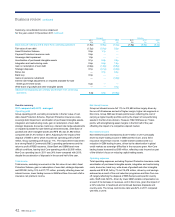
Basic loss per ordinary and B share from continuing operations (1.8p) (0.5p) (6.3p) (1.8p) (0.5p) (6.3p)
Fair value of own debt (1.3p) (0.1p) 0.2p
Asset Protection Scheme 0.6p 1.1p —
Payment Protection Insurance costs 0.6p — —
Sovereign debt impairment 1.0p — —
Amortisation of purchased intangible assets 0.1p 0.2p 0.4p
Integration and restructuring costs 0.6p 0.8p 1.6p
Gain on redemption of own debt (0.2p) (1.0p) (6.8p)
Strategic disposals 0.1p (0.1p) (0.2p)
Bonus tax — 0.1p 0.4p
Bank levy 0.3p — —
Gains on pensions curtailment — — (3.0p)
Interest rate hedge adjustments on impaired available-for-sale
Greek government bonds 0.2p — —
Write-down of goodwill and other intangible assets — —0.7p
Adjusted earnings/(loss) per ordinary and B share from continuing
operations 0.2p 0.5p (13.0p)
Results summary
2011 compared with 2010 - managed
Operating profit
Groupoperating profit, excluding movements in the fair value of own
debt, Asset Protection Scheme, Payment Protection Insurance costs,
sovereign debt impairment, amortisation of purchased intangible assets,
integration and restructuring costs, gain on redemption of own debt,
strategic disposals, bonus tax, bank levy, interest rate hedge adjustments
on impaired available-for-sale Greek government bonds, write-down of
goodwill and other intangible assets and RFS MI, was £1,892 million
compared with £1,913 million in 2010. Adjusting for the impact of the
disposal of GMS in 2010, which recorded an operating profit of £207
million, Group operating profit was up 11%. The improvement was driven
by a strong Retail & Commercial (R&C) operating performance and the
return to profit of RBS Insurance. Ulster Bank and GBM faced more
difficult conditions, leaving total Core operating profit at £6,095 million.
Non-Core operating loss in 2011 was 24% lower compared with 2010,
despite the acceleration of disposals in the second half of the year.
Total income
Total income, excluding movements in the fair value of own debt, Asset
Protection Scheme, gain on redemption of own debt, strategic disposals
and RFS MI, fell by 15% to £27,777 million, primarily reflecting lower net
interest income, lower trading income in GBM and Non-Core and a fall in
insurance net premium income.
Net interest income
Group net interest income fell 11% to £12,689 million largely driven by
the run-off of balances and exit of higher margin, higher risk segments in
Non-Core. Group NIM was 9 basis points lower, reflecting the cost of
carrying a higher liquidity portfolio and by the impact of non-performing
assets in the Non-Core division. However, R&C NIM was up 7 basis
points, with strengthening asset margins in the first half of the year
offsetting the impact of a competitive deposit market.
Non-interest income
Non-interest income decreased by£3,374 million in 2011 principally
driven by lower trading income in GBM and Non-Core, and a fall in
insurance net premium income. Volatile market conditions led to a
reduction in GBM trading income, driven by the deterioration in global
credit markets as sovereign difficulties in the eurozone grew. Non-Core
trading losses increased by £690 million, reflecting costs incurred as part
of the division’s focus on reducing capital trading assets.
Operating expenses
Total operating expenses, excluding Payment Protection Insurance costs,
amortisation of purchased intangible assets, integration and restructuring
costs, bonus tax, bank levy, write-down of goodwill and other intangible
assets and RFS MI, fell by 7% to £15,478 million, driven by cost savings
achieved as a result of the cost reduction programme and Non-Core run-
off, largely reflecting the disposal of RBS Sempra and specific country
exits. Staff costs fell 9%, driven by lower GBM variable compensation as
aresult of its decrease in revenues, and in Non-Core, given the impact of
a32% reduction in headcount and continued business disposals and
country exits. The Group cost:income ratio was 62% in 2011 compared
with 60% in 2010.
Business review continued