RBS 2011 Annual Report Download - page 55
Download and view the complete annual report
Please find page 55 of the 2011 RBS annual report below. You can navigate through the pages in the report by either clicking on the pages listed below, or by using the keyword search tool below to find specific information within the annual report.-
 1
1 -
2
-
3
-
4
-
5
-
6
-
7
-
8
-
9
-
10
-
11
-
12
-
13
-
14
-
15
-
16
-
17
-
18
-
19
-
20
-
21
-
22
-
23
-
24
-
25
-
26
-
27
-
28
-
29
-
30
-
31
-
32
-
33
-
34
-
35
-
36
-
37
-
38
-
39
-
40
-
41
-
42
-
43
-
44
-
 45
45 -
 46
46 -
 47
47 -
 48
48 -
 49
49 -
 50
50 -
 51
51 -
 52
52 -
 53
53 -
 54
54 -
 55
55 -
 56
56 -
 57
57 -
 58
58 -
 59
59 -
 60
60 -
 61
61 -
 62
62 -
 63
63 -
 64
64 -
 65
65 -
66
-
67
-
68
-
69
-
70
-
71
-
72
-
73
-
74
-
75
-
76
-
77
-
78
-
79
-
80
-
81
-
82
-
83
-
84
-
85
-
86
-
87
-
88
-
89
-
90
-
91
-
92
-
93
-
94
-
95
-
96
-
97
-
98
-
99
-
100
-
101
-
102
-
103
-
104
-
105
-
106
-
107
-
108
-
109
-
110
-
111
-
112
-
113
-
114
-
115
-
116
-
117
-
118
-
119
-
120
-
121
-
122
-
123
-
124
-
125
-
126
-
127
-
128
-
129
-
130
-
131
-
132
-
133
-
134
-
135
-
136
-
137
-
138
-
139
-
140
-
141
-
142
-
143
-
144
-
145
-
146
-
147
-
148
-
149
-
150
-
151
-
152
-
153
-
154
-
155
-
156
-
157
-
158
-
159
-
160
-
161
-
162
-
163
-
164
-
165
-
166
-
167
-
168
-
169
-
170
-
171
-
172
-
173
-
174
-
175
-
176
-
177
-
178
-
179
-
180
-
181
-
182
-
183
-
184
-
185
-
186
-
187
-
188
-
189
-
190
-
191
-
192
-
193
-
194
-
195
-
196
-
197
-
198
-
199
-
200
-
201
-
202
-
203
-
204
-
205
-
206
-
207
-
208
-
209
-
210
-
211
-
212
-
213
-
214
-
215
-
216
-
217
-
218
-
219
-
220
-
221
-
222
-
223
-
224
-
225
-
226
-
227
-
228
-
229
-
230
-
231
-
232
-
233
-
234
-
235
-
236
-
237
-
238
-
239
-
240
-
241
-
242
-
243
-
244
-
245
-
246
-
247
-
248
-
249
-
250
-
251
-
252
-
253
-
254
-
255
-
256
-
257
-
258
-
259
-
260
-
261
-
262
-
263
-
264
-
265
-
266
-
267
-
268
-
269
-
270
-
271
-
272
-
273
-
274
-
275
-
276
-
277
-
278
-
279
-
280
-
281
-
282
-
283
-
284
-
285
-
286
-
287
-
288
-
289
-
290
-
291
-
292
-
293
-
294
-
295
-
296
-
297
-
298
-
299
-
300
-
301
-
302
-
303
-
304
-
305
-
306
-
307
-
308
-
309
-
310
-
311
-
312
-
313
-
314
-
315
-
316
-
317
-
318
-
319
-
320
-
321
-
322
-
323
-
324
-
325
-
326
-
327
-
328
-
329
-
330
-
331
-
332
-
333
-
334
-
335
-
336
-
337
-
338
-
339
-
340
-
341
-
342
-
343
-
344
-
345
-
346
-
347
-
348
-
349
-
350
-
351
-
352
-
353
-
354
-
355
-
356
-
357
-
358
-
359
-
360
-
361
-
362
-
363
-
364
-
365
-
366
-
367
-
368
-
369
-
370
-
371
-
372
-
373
-
374
-
375
-
376
-
377
-
378
-
379
-
380
-
381
-
382
-
383
-
384
-
385
-
386
-
387
-
388
-
389
-
390
-
391
-
392
-
393
-
394
-
395
-
396
-
397
-
398
-
399
-
400
-
401
-
402
-
403
-
404
-
405
-
406
-
407
-
408
-
409
-
410
-
411
-
412
-
413
-
414
-
415
-
416
-
417
-
418
-
419
-
420
-
421
-
422
-
423
-
424
-
425
-
426
-
427
-
428
-
429
-
430
-
431
-
432
-
433
-
434
-
435
-
436
-
437
-
438
-
439
-
440
-
441
-
442
-
443
-
444
-
445
-
446
-
447
-
448
-
449
-
450
-
451
-
452
-
453
-
454
-
455
-
456
-
457
-
458
-
459
-
460
-
461
-
462
-
463
-
464
-
465
-
466
-
467
-
468
-
469
-
470
-
471
-
472
-
473
-
474
-
475
-
476
-
477
-
478
-
479
-
480
-
481
-
482
-
483
-
484
-
485
-
486
-
487
-
488
-
489
-
490
 |
 |

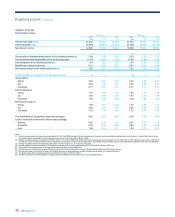
RBS Group 2011 53
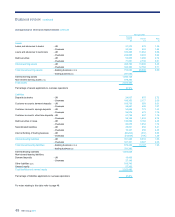
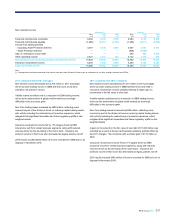
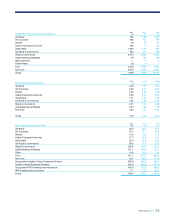
Non-interest income
Managed (1) Statutory
2011 2010 2009 2011 2010 2009
£m £m £m £m £m £m
Fees and commissions receivable 6,384 8,194 8,738 6,384 8,193 8,738
Fees and commissions payable (1,460) (2,211) (2,790) (1,460) (2,211) (2,790)
Income from trading activities
-excluding Asset Protection Scheme 3,381 6,138 3,999 3,607 6,067 3,761
- Asset Protection Scheme — — — (906) (1,550) —
Gain on redemption of own debt — — — 255 553 3,790
Other operating income 2,527 1,213 787 4,122 1,479 873
Non-interest income (excluding insurance net premium income) 10,832 13,334 10,734 12,002 12,531 14,372
Insurance net premium income 4,256 5,128 5,266 4,256 5,128 5,266
Total non-interest income 15,088 18,462 16,000 16,258 17,659 19,638
Note:
(1) Managed basis excludes movements in fair value of own debt, Asset Protection Scheme, gain on redemption of own debt, strategic disposals and RFS MI.
2011 compared with 2010 - managed
Non-interest income decreased by £3,374 million in 2011 principally
driven by lower trading income in GBM and Non-Core and a fall in
insurance net premium income.
Volatile market conditions led to a reduction in GBM trading income,
driven by the deterioration in global credit markets as sovereign
difficulties in the eurozone grew.
Non-Core trading losses increased by £690 million, reflecting costs
incurred as part of the division’s focus on reducing capital trading assets,
with activity including the restructuring of monoline exposures, which
mitigated both significant immediate and future regulatory uplifts in risk-
weighted assets.
Insurance net premium income fell by 17% largely driven by RBS
Insurance’s exit from certain business segments, along with reduced
volumes driven by the de-risking of the motor book. Insurance net
premium income in Non-Core also decreased as legacy policies ran-off.
2010 results included £482 million of income recorded for GMS prior to its
disposal in November 2010.
2011 compared with 2010 - statutory
Non-interest income decreased by£1,401 million in 2011 principally
driven by lower trading income in GBM and Non-Core and a fall in
insurance net premium income, partially offset by a higher gain on
movements in the fair value of own debt.
Volatile market conditions led to a reduction in GBM trading income,
driven by the deterioration in global credit markets as sovereign
difficulties in the eurozone grew.
Non-Core trading losses increased by £690 million, reflecting costs
incurred as part of the division’s focus on reducing capital trading assets,
with activity including the restructuring of monoline exposures, which
mitigated both significant immediate and future regulatory uplifts in risk-
weighted assets.
Again on movements in the fair value of own debt of £1,846 million was
recorded as a result of Group credit spreads widening, partially offset by
the 2011 charges. This compares with a smaller gain of £174 million in
2010.
Insurance net premium income fell by 17% largely driven by RBS
Insurance’s exit from certain business segments, along with reduced
volumes driven by the de-risking of the motor book. Insurance net
premium income in Non-Core also decreased as legacy policies ran-off.
2010 results included £482 million of income recorded for GMS prior to its
disposal in November 2010.