RBS 2011 Annual Report Download - page 81
Download and view the complete annual report
Please find page 81 of the 2011 RBS annual report below. You can navigate through the pages in the report by either clicking on the pages listed below, or by using the keyword search tool below to find specific information within the annual report.-
 1
1 -
2
-
3
-
4
-
5
-
6
-
7
-
8
-
9
-
10
-
11
-
12
-
13
-
14
-
15
-
16
-
17
-
18
-
19
-
20
-
21
-
22
-
23
-
24
-
25
-
26
-
27
-
28
-
29
-
30
-
31
-
32
-
33
-
34
-
35
-
36
-
37
-
38
-
39
-
40
-
41
-
42
-
43
-
44
-
45
-
46
-
47
-
48
-
49
-
50
-
51
-
52
-
53
-
54
-
55
-
56
-
57
-
58
-
59
-
60
-
61
-
62
-
63
-
64
-
65
-
66
-
67
-
68
-
69
-
70
-
 71
71 -
 72
72 -
 73
73 -
 74
74 -
 75
75 -
 76
76 -
 77
77 -
 78
78 -
 79
79 -
 80
80 -
 81
81 -
 82
82 -
 83
83 -
 84
84 -
 85
85 -
 86
86 -
 87
87 -
 88
88 -
 89
89 -
 90
90 -
 91
91 -
92
-
93
-
94
-
95
-
96
-
97
-
98
-
99
-
100
-
101
-
102
-
103
-
104
-
105
-
106
-
107
-
108
-
109
-
110
-
111
-
112
-
113
-
114
-
115
-
116
-
117
-
118
-
119
-
120
-
121
-
122
-
123
-
124
-
125
-
126
-
127
-
128
-
129
-
130
-
131
-
132
-
133
-
134
-
135
-
136
-
137
-
138
-
139
-
140
-
141
-
142
-
143
-
144
-
145
-
146
-
147
-
148
-
149
-
150
-
151
-
152
-
153
-
154
-
155
-
156
-
157
-
158
-
159
-
160
-
161
-
162
-
163
-
164
-
165
-
166
-
167
-
168
-
169
-
170
-
171
-
172
-
173
-
174
-
175
-
176
-
177
-
178
-
179
-
180
-
181
-
182
-
183
-
184
-
185
-
186
-
187
-
188
-
189
-
190
-
191
-
192
-
193
-
194
-
195
-
196
-
197
-
198
-
199
-
200
-
201
-
202
-
203
-
204
-
205
-
206
-
207
-
208
-
209
-
210
-
211
-
212
-
213
-
214
-
215
-
216
-
217
-
218
-
219
-
220
-
221
-
222
-
223
-
224
-
225
-
226
-
227
-
228
-
229
-
230
-
231
-
232
-
233
-
234
-
235
-
236
-
237
-
238
-
239
-
240
-
241
-
242
-
243
-
244
-
245
-
246
-
247
-
248
-
249
-
250
-
251
-
252
-
253
-
254
-
255
-
256
-
257
-
258
-
259
-
260
-
261
-
262
-
263
-
264
-
265
-
266
-
267
-
268
-
269
-
270
-
271
-
272
-
273
-
274
-
275
-
276
-
277
-
278
-
279
-
280
-
281
-
282
-
283
-
284
-
285
-
286
-
287
-
288
-
289
-
290
-
291
-
292
-
293
-
294
-
295
-
296
-
297
-
298
-
299
-
300
-
301
-
302
-
303
-
304
-
305
-
306
-
307
-
308
-
309
-
310
-
311
-
312
-
313
-
314
-
315
-
316
-
317
-
318
-
319
-
320
-
321
-
322
-
323
-
324
-
325
-
326
-
327
-
328
-
329
-
330
-
331
-
332
-
333
-
334
-
335
-
336
-
337
-
338
-
339
-
340
-
341
-
342
-
343
-
344
-
345
-
346
-
347
-
348
-
349
-
350
-
351
-
352
-
353
-
354
-
355
-
356
-
357
-
358
-
359
-
360
-
361
-
362
-
363
-
364
-
365
-
366
-
367
-
368
-
369
-
370
-
371
-
372
-
373
-
374
-
375
-
376
-
377
-
378
-
379
-
380
-
381
-
382
-
383
-
384
-
385
-
386
-
387
-
388
-
389
-
390
-
391
-
392
-
393
-
394
-
395
-
396
-
397
-
398
-
399
-
400
-
401
-
402
-
403
-
404
-
405
-
406
-
407
-
408
-
409
-
410
-
411
-
412
-
413
-
414
-
415
-
416
-
417
-
418
-
419
-
420
-
421
-
422
-
423
-
424
-
425
-
426
-
427
-
428
-
429
-
430
-
431
-
432
-
433
-
434
-
435
-
436
-
437
-
438
-
439
-
440
-
441
-
442
-
443
-
444
-
445
-
446
-
447
-
448
-
449
-
450
-
451
-
452
-
453
-
454
-
455
-
456
-
457
-
458
-
459
-
460
-
461
-
462
-
463
-
464
-
465
-
466
-
467
-
468
-
469
-
470
-
471
-
472
-
473
-
474
-
475
-
476
-
477
-
478
-
479
-
480
-
481
-
482
-
483
-
484
-
485
-
486
-
487
-
488
-
489
-
490
 |
 |

RBS Group 2011 79
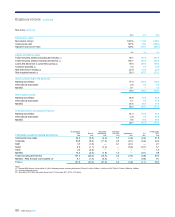
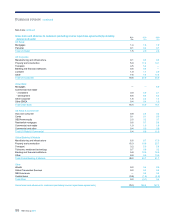
2011 2010 2009
£bn £bn £bn
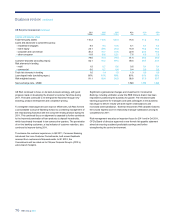
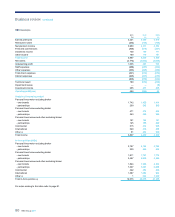
Capital and balance sheet
Loans and advances to customers 74.7 75.1 90.9
Loans and advances to banks 29.9 44.5 36.9
Reverse repos 100.5 94.8 73.3
Securities 111.0 119.2 106.0
Cash and eligible bills 28.1 38.8 74.0
Other 17.5 24.3 31.1
Total third party assets (excluding derivatives mark-to-market) 361.7 396.7 412.2
Net derivative assets (after netting) 37.0 37.4 68.0
Customer deposits (excluding repos) 37.4 38.9 46.9
Risk elements in lending 1.8 1.7 1.8
Risk-weighted assets 151.1 146.9 123.7
During Q4 2011, the market environment continued to weaken. Market
volatility remained elevated and liquidity depressed as markets reacted to
developments in the European sovereign debt crisis. Deal flow was weak
reflecting investor pessimism about the outlook for the world economy.
Throughout the year, GBM continued to deliver core products and
innovative solutions to clients, while also focusing on management of its
cost base and on tight control of its risk positions.
On 12 January 2012 the Group announced changes to its wholesale
banking operations in light of a changed market and regulatory
environment. The changes will see the reorganisation of RBS’s wholesale
businesses into ‘Markets’ and ‘International Banking’ and the exit and
downsizing of selected activities. The changes will ensure the wholesale
businesses continue to deliver against the Group’s strategy.
2011 compared with 2010
Operating profit fell by 54%, from £3,364 million for 2010 to £1,561 million
for 2011, driven by a 25% decrease in revenue. The year was
characterised by volatile and deteriorating credit markets, especially
during the second half of the year when the European sovereign debt
crisis drove a sharp widening in credit spreads.
Due to this deterioration in the markets both the Rates and Credit
businesses suffered significantly, and income from trading activities fell
from £4,982 million in 2010, to £3,736 million in 2011. The heightened
volatility increased risk aversion amongst clients and limited opportunities
for revenue generation in the secondary markets.
Portfolio Management and Origination revenue also fell sharply as clients
curtailed new activity and continued to repay existing debt.
Equities revenue fell 16% as wider market conditions reduced investor
confidence, resulting in lower client issuance and reduced activity in the
secondary markets.
Total costs fell by 2% despite increased investment costs in 2011, which
included a programme to meet new regulatory requirements. The
compensation ratio in GBM excluding discontinued businesses was 39%,
driven by fixed salary costs and prior year deferred awards. Variable
compensation accrued in the first half of the year were reduced in the
second half of the year, leaving the 2011 variable compensation awards
58% lower than 2010, compared with a 54% fall in operating profit, as
detailed on page 78.
Third party assets fell from £396.7 billion in 2010 to £361.7 billion in 2011
as a result of lower levels of activity and careful management of balance
sheet exposures.
A3% increase in risk-weighted assets reflected the impact of significant
regulatory changes, with a £21 billion uplift as a result of CRD III, largely
offset by the impact of the division’s focus on risk management.
2010 compared with 2009
Afall in operating profit, of 42%year on year reflects sharply reduced
revenue partially offset by lower costs and a significant improvement in
impairments.
Total income was £3,146 million lower in 2010 driven by increased risk
aversion in the market during Q3 and Q4 2010, combined with the non-
repeat of favourable market conditions seen in the first half of 2009.
xHigher revenue across the Rates and Currencies businesses during
2009 was driven by rapidly falling interest rates and wide bid-offer
spreads generating exceptional revenue opportunities, which have
not been repeated in 2010.
xThe Credit Markets business remained broadly flat, supported by
strong Mortgage Trading income where customer demand remained
buoyant during 2010.
xIncreased revenue from Portfolio Management was driven by
disciplined lending alongside a reduction in balance sheet
management activities and associated costs.
Expenses fell by 6% to £4,397 million. This was largely driven by a
decrease in staff costs, including on-going benefits from cost synergies.
The low level of impairments in 2010 reflected a small number of specific
cases partially offset by an improved picture on latent loss provisions.
This contrasted with 2009, which witnessed a significantly higher level of
specific impairments.
At 16.6%, return on equity remained consistent with the 15% targeted
over the business cycle in GBM’s strategic plan. The compensation ratio
of 34% was below that of peers.