RBS 2011 Annual Report Download - page 147
Download and view the complete annual report
Please find page 147 of the 2011 RBS annual report below. You can navigate through the pages in the report by either clicking on the pages listed below, or by using the keyword search tool below to find specific information within the annual report.-
 1
1 -
2
-
3
-
4
-
5
-
6
-
7
-
8
-
9
-
10
-
11
-
12
-
13
-
14
-
15
-
16
-
17
-
18
-
19
-
20
-
21
-
22
-
23
-
24
-
25
-
26
-
27
-
28
-
29
-
30
-
31
-
32
-
33
-
34
-
35
-
36
-
37
-
38
-
39
-
40
-
41
-
42
-
43
-
44
-
45
-
46
-
47
-
48
-
49
-
50
-
51
-
52
-
53
-
54
-
55
-
56
-
57
-
58
-
59
-
60
-
61
-
62
-
63
-
64
-
65
-
66
-
67
-
68
-
69
-
70
-
71
-
72
-
73
-
74
-
75
-
76
-
77
-
78
-
79
-
80
-
81
-
82
-
83
-
84
-
85
-
86
-
87
-
88
-
89
-
90
-
91
-
92
-
93
-
94
-
95
-
96
-
97
-
98
-
99
-
100
-
101
-
102
-
103
-
104
-
105
-
106
-
107
-
108
-
109
-
110
-
111
-
112
-
113
-
114
-
115
-
116
-
117
-
118
-
119
-
120
-
121
-
122
-
123
-
124
-
125
-
126
-
127
-
128
-
129
-
130
-
131
-
132
-
133
-
134
-
135
-
136
-
 137
137 -
 138
138 -
 139
139 -
 140
140 -
 141
141 -
 142
142 -
 143
143 -
 144
144 -
 145
145 -
 146
146 -
 147
147 -
 148
148 -
 149
149 -
 150
150 -
 151
151 -
 152
152 -
 153
153 -
 154
154 -
 155
155 -
 156
156 -
 157
157 -
158
-
159
-
160
-
161
-
162
-
163
-
164
-
165
-
166
-
167
-
168
-
169
-
170
-
171
-
172
-
173
-
174
-
175
-
176
-
177
-
178
-
179
-
180
-
181
-
182
-
183
-
184
-
185
-
186
-
187
-
188
-
189
-
190
-
191
-
192
-
193
-
194
-
195
-
196
-
197
-
198
-
199
-
200
-
201
-
202
-
203
-
204
-
205
-
206
-
207
-
208
-
209
-
210
-
211
-
212
-
213
-
214
-
215
-
216
-
217
-
218
-
219
-
220
-
221
-
222
-
223
-
224
-
225
-
226
-
227
-
228
-
229
-
230
-
231
-
232
-
233
-
234
-
235
-
236
-
237
-
238
-
239
-
240
-
241
-
242
-
243
-
244
-
245
-
246
-
247
-
248
-
249
-
250
-
251
-
252
-
253
-
254
-
255
-
256
-
257
-
258
-
259
-
260
-
261
-
262
-
263
-
264
-
265
-
266
-
267
-
268
-
269
-
270
-
271
-
272
-
273
-
274
-
275
-
276
-
277
-
278
-
279
-
280
-
281
-
282
-
283
-
284
-
285
-
286
-
287
-
288
-
289
-
290
-
291
-
292
-
293
-
294
-
295
-
296
-
297
-
298
-
299
-
300
-
301
-
302
-
303
-
304
-
305
-
306
-
307
-
308
-
309
-
310
-
311
-
312
-
313
-
314
-
315
-
316
-
317
-
318
-
319
-
320
-
321
-
322
-
323
-
324
-
325
-
326
-
327
-
328
-
329
-
330
-
331
-
332
-
333
-
334
-
335
-
336
-
337
-
338
-
339
-
340
-
341
-
342
-
343
-
344
-
345
-
346
-
347
-
348
-
349
-
350
-
351
-
352
-
353
-
354
-
355
-
356
-
357
-
358
-
359
-
360
-
361
-
362
-
363
-
364
-
365
-
366
-
367
-
368
-
369
-
370
-
371
-
372
-
373
-
374
-
375
-
376
-
377
-
378
-
379
-
380
-
381
-
382
-
383
-
384
-
385
-
386
-
387
-
388
-
389
-
390
-
391
-
392
-
393
-
394
-
395
-
396
-
397
-
398
-
399
-
400
-
401
-
402
-
403
-
404
-
405
-
406
-
407
-
408
-
409
-
410
-
411
-
412
-
413
-
414
-
415
-
416
-
417
-
418
-
419
-
420
-
421
-
422
-
423
-
424
-
425
-
426
-
427
-
428
-
429
-
430
-
431
-
432
-
433
-
434
-
435
-
436
-
437
-
438
-
439
-
440
-
441
-
442
-
443
-
444
-
445
-
446
-
447
-
448
-
449
-
450
-
451
-
452
-
453
-
454
-
455
-
456
-
457
-
458
-
459
-
460
-
461
-
462
-
463
-
464
-
465
-
466
-
467
-
468
-
469
-
470
-
471
-
472
-
473
-
474
-
475
-
476
-
477
-
478
-
479
-
480
-
481
-
482
-
483
-
484
-
485
-
486
-
487
-
488
-
489
-
490
 |
 |

RBS Group 2011 145
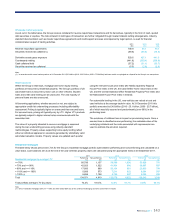
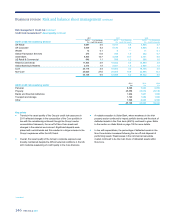
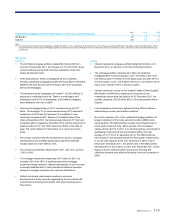
Key points
xExposure to retail portfolios within the UK Retail, Ulster Bank and
US Retail & Commercial divisions remained broadly constant during
the year. A reduction in wholesale portfolios was seen across all
divisions, with the exception of Wealth, for which product demand
and risk appetite typically have more in common with retail portfolios.
Another exception was ‘Other’, which is driven by Treasury where
growth in credit risk assets relates to exposure to central banks in
the USA, the UK and Germany and is a function of the Group’s
liquidity requirements and cash positions.
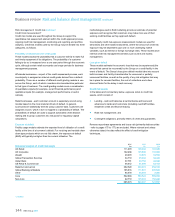
xNon-Core exposure declined during 2011 as a result of the
continued disposal and run-off of assets. Substantial de-risking was
achieved though an exposure reduction of £33 billion over the year,
in line with balance sheet reduction targets. Significantly, the division
was able to take action to reduce exposure within the Middle East &
North Africa region, which saw material volatility early in 2011
(exposure down 66%). The division also reduced single name
concentration excesses, in part due to disposals in the leveraged
finance book. In addition, the division’s project finance business
achieved a material reduction through asset sales, unwinding of
trades within the markets business and legal defeasance of
structured finance transactions.
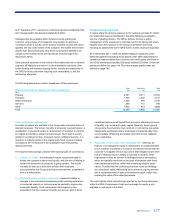
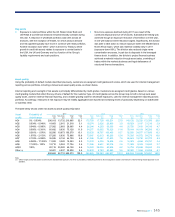
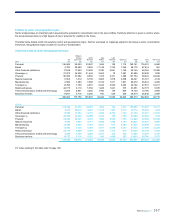
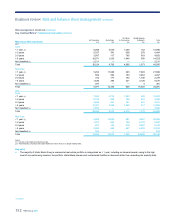
Asset quality
Using the probability of default models described previously, customers are assigned credit grades and scores, which are used for internal management
reporting across portfolios, including a Group level asset quality scale, as shown below.
Internal reporting and oversight of risk assets is principally differentiated by credit grades. Customers are assigned credit grades, based on various
credit grading models that reflect the key drivers of default for the customer type. All credit grades across the Group map to both a Group level asset
quality scale, used for external financial reporting, and a master grading scale for wholesale exposures, used for internal management reporting across
portfolios. Accordingly, measures of risk exposure may be readily aggregated and reported at increasing levels of granularity depending on stakeholder
or business need.
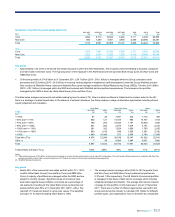
The table below shows credit risk assets by asset quality (AQ) band:
2011 2010 2009
Asset
quality
Probability of
default range Core
£m
Non-Core
£m
Total
£m
Total
%
Core
£m
Non-Core
£m
Total
£m
Total
%
Core
£m
Non-Core
£m
Total
£m
Total
%
AQ1 0% - 0.034% 206,163 13,732 219,895 32.1 175,793 17,728 193,521 27.8 149,132 23,226 172,358 23.8
AQ2 0.034% - 0.048% 18,403 2,915 21,318 3.1 18,274 2,526 20,800 3.0 18,029 3,187 21,216 2.9
AQ3 0.048% - 0.095% 27,082 2,883 29,965 4.4 26,244 4,259 30,503 4.4 26,703 7,613 34,316 4.7
AQ4 0.095% - 0.381% 65,492 9,636 75,128 11.0 64,277 15,052 79,329 11.4 78,144 18,154 96,298 13.3
AQ5 0.381% - 1.076% 92,506 10,873 103,379 15.1 90,639 18,767 109,406 15.7 92,908 24,977 117,885 16.3
AQ6 1.076% - 2.153% 67,260 6,636 73,896 10.8 73,367 12,913 86,280 12.4 76,206 18,072 94,278 13.0
AQ7 2.153% - 6.089% 36,595 8,134 44,729 6.5 41,399 10,451 51,850 7.5 44,643 15,732 60,375 8.3
AQ8 6.089% - 17.222% 11,933 3,320 15,253 2.2 15,300 4,308 19,608 2.8 18,923 4,834 23,757 3.4
AQ9 17.222% - 100% 12,710 5,024 17,734 2.6 11,398 8,621 20,019 2.9 11,589 8,074 19,663 2.7
AQ10 100% 20,118 25,020 45,138 6.6 18,003 25,005 43,008 6.2 16,756 22,666 39,422 5.5
Other (1) 34,401 4,537 38,938 5.6 34,830 5,753 40,583 5.9 32,025 11,964 43,989 6.1
592,663 92,710 685,373 100.0 569,524 125,383 694,907 100.0 565,058 158,499 723,557 100.0
Note:
(1) ‘Other’ largely comprises assets covered by the standardised approach, for which a probability of default equivalent to those assigned to assets covered by the internal ratings based approach is not
available.