RBS 2011 Annual Report Download - page 57
Download and view the complete annual report
Please find page 57 of the 2011 RBS annual report below. You can navigate through the pages in the report by either clicking on the pages listed below, or by using the keyword search tool below to find specific information within the annual report.-
 1
1 -
2
-
3
-
4
-
5
-
6
-
7
-
8
-
9
-
10
-
11
-
12
-
13
-
14
-
15
-
16
-
17
-
18
-
19
-
20
-
21
-
22
-
23
-
24
-
25
-
26
-
27
-
28
-
29
-
30
-
31
-
32
-
33
-
34
-
35
-
36
-
37
-
38
-
39
-
40
-
41
-
42
-
43
-
44
-
45
-
46
-
 47
47 -
 48
48 -
 49
49 -
 50
50 -
 51
51 -
 52
52 -
 53
53 -
 54
54 -
 55
55 -
 56
56 -
 57
57 -
 58
58 -
 59
59 -
 60
60 -
 61
61 -
 62
62 -
 63
63 -
 64
64 -
 65
65 -
 66
66 -
 67
67 -
68
-
69
-
70
-
71
-
72
-
73
-
74
-
75
-
76
-
77
-
78
-
79
-
80
-
81
-
82
-
83
-
84
-
85
-
86
-
87
-
88
-
89
-
90
-
91
-
92
-
93
-
94
-
95
-
96
-
97
-
98
-
99
-
100
-
101
-
102
-
103
-
104
-
105
-
106
-
107
-
108
-
109
-
110
-
111
-
112
-
113
-
114
-
115
-
116
-
117
-
118
-
119
-
120
-
121
-
122
-
123
-
124
-
125
-
126
-
127
-
128
-
129
-
130
-
131
-
132
-
133
-
134
-
135
-
136
-
137
-
138
-
139
-
140
-
141
-
142
-
143
-
144
-
145
-
146
-
147
-
148
-
149
-
150
-
151
-
152
-
153
-
154
-
155
-
156
-
157
-
158
-
159
-
160
-
161
-
162
-
163
-
164
-
165
-
166
-
167
-
168
-
169
-
170
-
171
-
172
-
173
-
174
-
175
-
176
-
177
-
178
-
179
-
180
-
181
-
182
-
183
-
184
-
185
-
186
-
187
-
188
-
189
-
190
-
191
-
192
-
193
-
194
-
195
-
196
-
197
-
198
-
199
-
200
-
201
-
202
-
203
-
204
-
205
-
206
-
207
-
208
-
209
-
210
-
211
-
212
-
213
-
214
-
215
-
216
-
217
-
218
-
219
-
220
-
221
-
222
-
223
-
224
-
225
-
226
-
227
-
228
-
229
-
230
-
231
-
232
-
233
-
234
-
235
-
236
-
237
-
238
-
239
-
240
-
241
-
242
-
243
-
244
-
245
-
246
-
247
-
248
-
249
-
250
-
251
-
252
-
253
-
254
-
255
-
256
-
257
-
258
-
259
-
260
-
261
-
262
-
263
-
264
-
265
-
266
-
267
-
268
-
269
-
270
-
271
-
272
-
273
-
274
-
275
-
276
-
277
-
278
-
279
-
280
-
281
-
282
-
283
-
284
-
285
-
286
-
287
-
288
-
289
-
290
-
291
-
292
-
293
-
294
-
295
-
296
-
297
-
298
-
299
-
300
-
301
-
302
-
303
-
304
-
305
-
306
-
307
-
308
-
309
-
310
-
311
-
312
-
313
-
314
-
315
-
316
-
317
-
318
-
319
-
320
-
321
-
322
-
323
-
324
-
325
-
326
-
327
-
328
-
329
-
330
-
331
-
332
-
333
-
334
-
335
-
336
-
337
-
338
-
339
-
340
-
341
-
342
-
343
-
344
-
345
-
346
-
347
-
348
-
349
-
350
-
351
-
352
-
353
-
354
-
355
-
356
-
357
-
358
-
359
-
360
-
361
-
362
-
363
-
364
-
365
-
366
-
367
-
368
-
369
-
370
-
371
-
372
-
373
-
374
-
375
-
376
-
377
-
378
-
379
-
380
-
381
-
382
-
383
-
384
-
385
-
386
-
387
-
388
-
389
-
390
-
391
-
392
-
393
-
394
-
395
-
396
-
397
-
398
-
399
-
400
-
401
-
402
-
403
-
404
-
405
-
406
-
407
-
408
-
409
-
410
-
411
-
412
-
413
-
414
-
415
-
416
-
417
-
418
-
419
-
420
-
421
-
422
-
423
-
424
-
425
-
426
-
427
-
428
-
429
-
430
-
431
-
432
-
433
-
434
-
435
-
436
-
437
-
438
-
439
-
440
-
441
-
442
-
443
-
444
-
445
-
446
-
447
-
448
-
449
-
450
-
451
-
452
-
453
-
454
-
455
-
456
-
457
-
458
-
459
-
460
-
461
-
462
-
463
-
464
-
465
-
466
-
467
-
468
-
469
-
470
-
471
-
472
-
473
-
474
-
475
-
476
-
477
-
478
-
479
-
480
-
481
-
482
-
483
-
484
-
485
-
486
-
487
-
488
-
489
-
490
 |
 |

RBS Group 2011 55
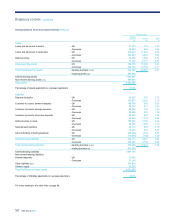
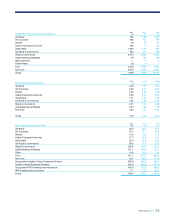
Operating expenses and insurance claims
Managed (1) Statutory
2011 2010 2009 2011 2010 2009
£m £m £m £m £m £m
Staff costs
-excluding gains on pensions curtailment 8,163 8,956 9,081 8,678 9,671 9,993
- gains on pensions curtailment — — — —— (2,148)
Premises and equipment 2,278 2,276 2,468 2,451 2,402 2,594
Other administrative expenses
-Payment Protection Insurance costs — — — 850 — —
-other 3,395 3,716 3,979 4,081 3,995 4,449
Administrative expenses 13,836 14,948 15,528 16,060 16,068 14,888
Depreciation and amortisation 1,642 1,762 1,873 1,875 2,150 2,166
Write-down of goodwill and other intangible assets — — — 91 10 363
Operating expenses 15,478 16,710 17,401
18,026 18,228 17,417
General insurance 2,968 4,698 4,223 2,968 4,698 4,223
Bancassurance — 85 134 —85 134
Insurance net claims 2,968 4,783 4,357 2,968 4,783 4,357
Staff costs as a percentage of total income 29% 27% 31% 30% 30% 30%
Note:
(1) Managed basis excludes Payment Protection Insurance costs, amortisation of purchased intangible assets, integration and restructuring costs, bonus tax, bank levy, gains on pensions curtailment,
write-down of goodwill and other intangible assets and RFS MI.
2011 compared with 2010 - managed
Group expenses were 7% lower in 2011, driven by cost savings achieved
as a result of the cost reduction programme and Non-Core run-off, largely
reflecting the disposal of RBS Sempra and specific country exits.
Staff costs fell 9%, driven by lower GBM variable compensation as a
result of its decrease in revenues, and in Non-Core, given the impact of a
32% reduction in headcount and continued business disposals and
country exits.
General insurance claims were £1,730 million lower, mainly due to the
non-repeat of bodily injury reserve strengthening in 2010, de-risking of
the motor book, more benign weather in 2011 and claims in Non-Core
decreasing as legacy policies ran-off.
The Group’s cost reduction programme delivered cost savings with an
underlying run rate of over £3 billion by the end of 2011.
2011 compared with 2010 - statutory
Groupexpenses fell by 1% in 2011, driven by cost savings achieved as a
result of the cost reduction programme and Non-Core run-off, largely
reflecting the disposal of RBS Sempra and specific country exits, partially
offset by Payment Protection Insurance costs.
Staff costs fell 10%, driven by lower GBM discretionary compensation as
aresult of its decrease in revenues, and in Non-Core, given the impact of
a32% reduction in headcount and continued business disposals and
country exits.
In May 2011, following the decision of the British Bankers’ Association
not to appeal the judgement of the judicial review, the Group recorded a
provision of £850 million in respect of the costs of Payment Protection
Insurance redress.
General insurance claims were £1,730 million lower, mainly due to the
non-repeat of bodily injury reserve strengthening in 2010, de-risking of
the motor book, more benign weather in 2011 and claims in Non-Core
decreasing as legacy policies ran-off.
The Group’s cost reduction programme delivered cost savings with an
underlying run rate of over £3 billion by the end of 2011.
2010 compared with 2009 - managed
The main driver of a 4% decrease in operating expenses is the
recognition of benefits from the Group-wide efficiency programme. The
programme continues to deliver material savings which have been
funding investments to strengthen our Core franchises. Annualised
savings are now just ahead of the £2.5 billion target for 2011 and are
forecast to exceed £3 billion by 2013.
Staff costs fell by £125 million to £8,956 million, principally driven by
savings in Global Banking & Markets, UK Retail and Non-Core.
Premises and equipment costs fell by 8% in the year to £2,276 million
largely driven by efficiency cost savings, significant one-off property
impairments recognised in 2009 and country exits following Non-Core
disposals.
Other expenses fell by £263 million to £3,716 million principally reflecting
continued savings from the Group’s efficiency programme.
Insurance net claims increased 10% to £4,783 million, driven by an
overall increase in bodily injury reserves, reflecting prior year claims and
more claims being settled as periodic payment orders. Severe weather
experienced during the first and fourth quarters of 2010 also drove up
claims in the year.