RBS 2011 Annual Report Download - page 353
Download and view the complete annual report
Please find page 353 of the 2011 RBS annual report below. You can navigate through the pages in the report by either clicking on the pages listed below, or by using the keyword search tool below to find specific information within the annual report.-
 1
1 -
2
-
3
-
4
-
5
-
6
-
7
-
8
-
9
-
10
-
11
-
12
-
13
-
14
-
15
-
16
-
17
-
18
-
19
-
20
-
21
-
22
-
23
-
24
-
25
-
26
-
27
-
28
-
29
-
30
-
31
-
32
-
33
-
34
-
35
-
36
-
37
-
38
-
39
-
40
-
41
-
42
-
43
-
44
-
45
-
46
-
47
-
48
-
49
-
50
-
51
-
52
-
53
-
54
-
55
-
56
-
57
-
58
-
59
-
60
-
61
-
62
-
63
-
64
-
65
-
66
-
67
-
68
-
69
-
70
-
71
-
72
-
73
-
74
-
75
-
76
-
77
-
78
-
79
-
80
-
81
-
82
-
83
-
84
-
85
-
86
-
87
-
88
-
89
-
90
-
91
-
92
-
93
-
94
-
95
-
96
-
97
-
98
-
99
-
100
-
101
-
102
-
103
-
104
-
105
-
106
-
107
-
108
-
109
-
110
-
111
-
112
-
113
-
114
-
115
-
116
-
117
-
118
-
119
-
120
-
121
-
122
-
123
-
124
-
125
-
126
-
127
-
128
-
129
-
130
-
131
-
132
-
133
-
134
-
135
-
136
-
137
-
138
-
139
-
140
-
141
-
142
-
143
-
144
-
145
-
146
-
147
-
148
-
149
-
150
-
151
-
152
-
153
-
154
-
155
-
156
-
157
-
158
-
159
-
160
-
161
-
162
-
163
-
164
-
165
-
166
-
167
-
168
-
169
-
170
-
171
-
172
-
173
-
174
-
175
-
176
-
177
-
178
-
179
-
180
-
181
-
182
-
183
-
184
-
185
-
186
-
187
-
188
-
189
-
190
-
191
-
192
-
193
-
194
-
195
-
196
-
197
-
198
-
199
-
200
-
201
-
202
-
203
-
204
-
205
-
206
-
207
-
208
-
209
-
210
-
211
-
212
-
213
-
214
-
215
-
216
-
217
-
218
-
219
-
220
-
221
-
222
-
223
-
224
-
225
-
226
-
227
-
228
-
229
-
230
-
231
-
232
-
233
-
234
-
235
-
236
-
237
-
238
-
239
-
240
-
241
-
242
-
243
-
244
-
245
-
246
-
247
-
248
-
249
-
250
-
251
-
252
-
253
-
254
-
255
-
256
-
257
-
258
-
259
-
260
-
261
-
262
-
263
-
264
-
265
-
266
-
267
-
268
-
269
-
270
-
271
-
272
-
273
-
274
-
275
-
276
-
277
-
278
-
279
-
280
-
281
-
282
-
283
-
284
-
285
-
286
-
287
-
288
-
289
-
290
-
291
-
292
-
293
-
294
-
295
-
296
-
297
-
298
-
299
-
300
-
301
-
302
-
303
-
304
-
305
-
306
-
307
-
308
-
309
-
310
-
311
-
312
-
313
-
314
-
315
-
316
-
317
-
318
-
319
-
320
-
321
-
322
-
323
-
324
-
325
-
326
-
327
-
328
-
329
-
330
-
331
-
332
-
333
-
334
-
335
-
336
-
337
-
338
-
339
-
340
-
341
-
342
-
 343
343 -
 344
344 -
 345
345 -
 346
346 -
 347
347 -
 348
348 -
 349
349 -
 350
350 -
 351
351 -
 352
352 -
 353
353 -
 354
354 -
 355
355 -
 356
356 -
 357
357 -
 358
358 -
 359
359 -
 360
360 -
 361
361 -
 362
362 -
 363
363 -
364
-
365
-
366
-
367
-
368
-
369
-
370
-
371
-
372
-
373
-
374
-
375
-
376
-
377
-
378
-
379
-
380
-
381
-
382
-
383
-
384
-
385
-
386
-
387
-
388
-
389
-
390
-
391
-
392
-
393
-
394
-
395
-
396
-
397
-
398
-
399
-
400
-
401
-
402
-
403
-
404
-
405
-
406
-
407
-
408
-
409
-
410
-
411
-
412
-
413
-
414
-
415
-
416
-
417
-
418
-
419
-
420
-
421
-
422
-
423
-
424
-
425
-
426
-
427
-
428
-
429
-
430
-
431
-
432
-
433
-
434
-
435
-
436
-
437
-
438
-
439
-
440
-
441
-
442
-
443
-
444
-
445
-
446
-
447
-
448
-
449
-
450
-
451
-
452
-
453
-
454
-
455
-
456
-
457
-
458
-
459
-
460
-
461
-
462
-
463
-
464
-
465
-
466
-
467
-
468
-
469
-
470
-
471
-
472
-
473
-
474
-
475
-
476
-
477
-
478
-
479
-
480
-
481
-
482
-
483
-
484
-
485
-
486
-
487
-
488
-
489
-
490
 |
 |

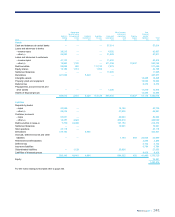
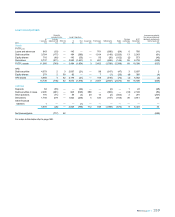
RBS Group 2011 351
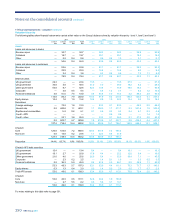
2011 2010 2009
Level 1 Level 2 Level 3 Total Level 1 Level 2 Level 3 Total Level 1 Level 2 Level 3 Total
\
£bn £bn £bn £bn £bn £bn £bn £bn £bn £bn £bn £bn
Liabilities
Deposits by banks
Repos — 23.3 — 23.3
—20.6 — 20.6 — 21.0 — 21.0
Collateral — 31.8 — 31.8 —26.6 — 26.6 — 28.2 — 28.2
Other — 2.4 — 2.4 —1.6 — 1.6 — 4.4 — 4.4
— 57.5 — 57.5 — 48.8 — 48.8 — 53.6 — 53.6
Customer accounts
Repos — 65.5 — 65.5 —53.0 — 53.0 — 41.5 — 41.5
Collateral — 9.2 — 9.2 —10.4 — 10.4 — 8.0 — 8.0
Other — 10.8 — 10.8 —8.7 0.1 8.8 — 11.8 0.1 11.9
—85.5 — 85.5 —72.1 0.1 72.2 — 61.3 0.1 61.4
Debt securities in issue — 45.0 2.2 47.2 —49.0 2.2 51.2 — 43.2 2.3 45.5
Short positions 34.4 6.3 0.3 41.0 35.0 7.3 0.8 43.1 27.1 13.2 0.2 40.5
Derivatives
Foreign exchange — 80.6 0.4 81.0 0.1 89.3 — 89.4 — 63.9 — 63.9
Interest rate 0.4 405.2 1.1 406.7 0.2 298.0 1.0 299.2 0.1 310.5 0.8 311.4
Equities and commodities — 9.1 0.5 9.6 0.1 9.6 0.4 10.1 1.0 8.5 0.2 9.7
Credit - APS — — 0.2 0.2 — — — — — — — —
Credit - other — 24.9 1.6 26.5 —25.0 0.3 25.3 — 38.1 1.0 39.1
0.4 519.8 3.8 524.0 0.4 421.9 1.7 424.0 1.1 421.0 2.0 424.1
Subordinated liabilities — 0.9 — 0.9 —1.1 — 1.1 — 1.3 — 1.3
34.8 715.0 6.3 756.1 35.4 600.2 4.8 640.4 28.2 593.6 4.6 626.4
Of which
Core 34.8 708.9 5.7 749.4
35.4 586.9 3.8 626.1
Non-Core — 6.1 0.6 6.7 —13.3 1.0 14.3
34.8 715.0 6.3 756.1 35.4 600.2 4.8 640.4
Proportion 4.6% 94.6% 0.8% 100.0% 5.5% 93.7% 0.8% 100.0% 4.5% 94.8% 0.7% 100.0%
Note:
(1) Level 1: valued using unadjusted quoted prices in active markets, for identical financial instruments. Examples include G10 government securities, listed equity shares, certain exchange-traded
derivatives and certain US agency securities.
Level 2: valued using techniques based significantly on observable market data. Instruments in this category are valued using:
(a) quoted prices for similar instruments or identical instruments in markets which are not considered to be active; or
(b) valuation techniques where all the inputs that have a significant effect on the valuations are directly or indirectly based on observable market data.
The type of instruments that trade in markets that are not considered to be active, but are based on quoted market prices, banker dealer quotations, or alternative pricing sources with reasonable
levels of price transparency and those instruments valued using techniques include non-G10 government securities, most government agency securities, investment-grade corporate bonds, certain
mortgage products, including CLOs, most bank loans, repos and reverse repos, less liquid listed equities, state and municipal obligations, most notes issued, investment contracts issued by the
Group's life assurance business (2009) and certain money market securities and loan commitments and most OTC derivatives.
Level 3: instruments in this category have been valued using a valuation technique where at least one input which could have a significant effect on the instrument’s valuation, is not based on
observable market data. Where inputs can be observed from market data without undue cost and effort, the observed input is used. Otherwise, the Group determines a reasonable level for the input.
Financial instruments primarily include cash instruments which trade infrequently, certain syndicated and commercial mortgage loans, unlisted equity shares, certain residual interests in
securitisations, majority of CDOs, other mortgage-backed products and less liquid debt securities, certain structured debt securities in issue, and OTC derivatives where valuation depends upon
unobservable inputs such as certain credit and exotic derivatives. No gain or loss is recognised on the initial recognition of a financial instrument valued using a technique incorporating significant
unobservable data.