RBS 2011 Annual Report Download - page 158
Download and view the complete annual report
Please find page 158 of the 2011 RBS annual report below. You can navigate through the pages in the report by either clicking on the pages listed below, or by using the keyword search tool below to find specific information within the annual report.-
 1
1 -
2
-
3
-
4
-
5
-
6
-
7
-
8
-
9
-
10
-
11
-
12
-
13
-
14
-
15
-
16
-
17
-
18
-
19
-
20
-
21
-
22
-
23
-
24
-
25
-
26
-
27
-
28
-
29
-
30
-
31
-
32
-
33
-
34
-
35
-
36
-
37
-
38
-
39
-
40
-
41
-
42
-
43
-
44
-
45
-
46
-
47
-
48
-
49
-
50
-
51
-
52
-
53
-
54
-
55
-
56
-
57
-
58
-
59
-
60
-
61
-
62
-
63
-
64
-
65
-
66
-
67
-
68
-
69
-
70
-
71
-
72
-
73
-
74
-
75
-
76
-
77
-
78
-
79
-
80
-
81
-
82
-
83
-
84
-
85
-
86
-
87
-
88
-
89
-
90
-
91
-
92
-
93
-
94
-
95
-
96
-
97
-
98
-
99
-
100
-
101
-
102
-
103
-
104
-
105
-
106
-
107
-
108
-
109
-
110
-
111
-
112
-
113
-
114
-
115
-
116
-
117
-
118
-
119
-
120
-
121
-
122
-
123
-
124
-
125
-
126
-
127
-
128
-
129
-
130
-
131
-
132
-
133
-
134
-
135
-
136
-
137
-
138
-
139
-
140
-
141
-
142
-
143
-
144
-
145
-
146
-
147
-
 148
148 -
 149
149 -
 150
150 -
 151
151 -
 152
152 -
 153
153 -
 154
154 -
 155
155 -
 156
156 -
 157
157 -
 158
158 -
 159
159 -
 160
160 -
 161
161 -
 162
162 -
 163
163 -
 164
164 -
 165
165 -
 166
166 -
 167
167 -
 168
168 -
169
-
170
-
171
-
172
-
173
-
174
-
175
-
176
-
177
-
178
-
179
-
180
-
181
-
182
-
183
-
184
-
185
-
186
-
187
-
188
-
189
-
190
-
191
-
192
-
193
-
194
-
195
-
196
-
197
-
198
-
199
-
200
-
201
-
202
-
203
-
204
-
205
-
206
-
207
-
208
-
209
-
210
-
211
-
212
-
213
-
214
-
215
-
216
-
217
-
218
-
219
-
220
-
221
-
222
-
223
-
224
-
225
-
226
-
227
-
228
-
229
-
230
-
231
-
232
-
233
-
234
-
235
-
236
-
237
-
238
-
239
-
240
-
241
-
242
-
243
-
244
-
245
-
246
-
247
-
248
-
249
-
250
-
251
-
252
-
253
-
254
-
255
-
256
-
257
-
258
-
259
-
260
-
261
-
262
-
263
-
264
-
265
-
266
-
267
-
268
-
269
-
270
-
271
-
272
-
273
-
274
-
275
-
276
-
277
-
278
-
279
-
280
-
281
-
282
-
283
-
284
-
285
-
286
-
287
-
288
-
289
-
290
-
291
-
292
-
293
-
294
-
295
-
296
-
297
-
298
-
299
-
300
-
301
-
302
-
303
-
304
-
305
-
306
-
307
-
308
-
309
-
310
-
311
-
312
-
313
-
314
-
315
-
316
-
317
-
318
-
319
-
320
-
321
-
322
-
323
-
324
-
325
-
326
-
327
-
328
-
329
-
330
-
331
-
332
-
333
-
334
-
335
-
336
-
337
-
338
-
339
-
340
-
341
-
342
-
343
-
344
-
345
-
346
-
347
-
348
-
349
-
350
-
351
-
352
-
353
-
354
-
355
-
356
-
357
-
358
-
359
-
360
-
361
-
362
-
363
-
364
-
365
-
366
-
367
-
368
-
369
-
370
-
371
-
372
-
373
-
374
-
375
-
376
-
377
-
378
-
379
-
380
-
381
-
382
-
383
-
384
-
385
-
386
-
387
-
388
-
389
-
390
-
391
-
392
-
393
-
394
-
395
-
396
-
397
-
398
-
399
-
400
-
401
-
402
-
403
-
404
-
405
-
406
-
407
-
408
-
409
-
410
-
411
-
412
-
413
-
414
-
415
-
416
-
417
-
418
-
419
-
420
-
421
-
422
-
423
-
424
-
425
-
426
-
427
-
428
-
429
-
430
-
431
-
432
-
433
-
434
-
435
-
436
-
437
-
438
-
439
-
440
-
441
-
442
-
443
-
444
-
445
-
446
-
447
-
448
-
449
-
450
-
451
-
452
-
453
-
454
-
455
-
456
-
457
-
458
-
459
-
460
-
461
-
462
-
463
-
464
-
465
-
466
-
467
-
468
-
469
-
470
-
471
-
472
-
473
-
474
-
475
-
476
-
477
-
478
-
479
-
480
-
481
-
482
-
483
-
484
-
485
-
486
-
487
-
488
-
489
-
490
 |
 |

156 RBS Group 2011
Risk management: Credit risk continued
Key credit portfolios* continued
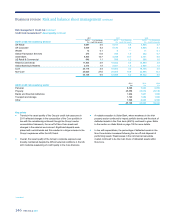
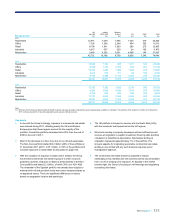
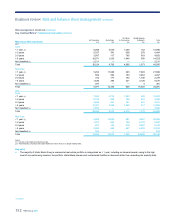
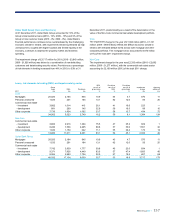
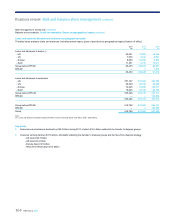
Retail credit assets: Personal lending
The Group’s personal lending portfolio includes credit cards, unsecured loans, auto finance and overdrafts. The majority of personal lending exposures
exist in the UK and the US. Impairment charges as a proportion of average loans and receivables are shown in the following table.
2011 2010 2009
Personal lending
Average
loans and
receivables
£m
Impairment
charge as a %
of average
loans and
receivables
%
Average
loans and
receivables
£m
Impairment
charge as a %
of average
loans and
receivables
%
Average
loans and
receivables
£m
Impairment
charge as a %
of average
loans and
receivables
%
UK Retail cards (1) 5,675 3.0 6,025 5.0 6,101 8.7
UK Retail loans (1) 7,755 2.8 9,863 4.8 12,062 5.9
Citizens cards (2) 936 5.1 1,005 9.9 1,145 9.7
Citizens auto loans (2) 4,856 0.2
5,256 0.6 6,306 1.2
Notes:
(1) The ratio for UK Retail assets refers to the impairment charges for the year. This is the Core UK loans book and excludes the Non-Core direct loans book that was sold in late 2011.
(2) The ratio for Citizens refers to the impairment charges in the year, net of recoveries realised in the year.
Key points
UK Retail
xThe UK personal lending portfolio, of which 99.4% is in Core
businesses, comprises credit cards, unsecured loans and
overdrafts, and totalled £16.0 billion at 31 December 2011 (2010 -
£18.1 billion).
xThe decrease in portfolio size of 11.6% was driven by continued
subdued loan recruitment activity and a continuing general
market trend of customers repaying unsecured debt.
xThe Non-Core portfolio consists of the direct finance loan
portfolios (Direct Line, Lombard, Mint and Churchill) and totalled
£0.1 billion at 31 December 2011 (2010 - £0.4 billion). In the last
quarter of 2011, a portfolio of £170 million of balances was
disposed of.
xRisk appetite continues to be actively managed across all
products with investment in collection and recovery processes
continuing, addressing both continued support for the Group’s
customers and the management of impairments.
xSupport continues for customers experiencing financial difficulties
through ‘breathing space initiatives’. Refer to the disclosures on
forbearance on page 140 for more information.
xThe impairment charge on unsecured lending was £579 million
for the year, down 42% on 2010, reflecting the effect of risk
appetite tightening. The sale of the direct finance loan book gave
rise to a one-off benefit of approximately £30 million.
xImpairments remain sensitive to the external environment,
including unemployment levels and interest rates.
xIndustry benchmarks for cards arrears remain stable, with the
Group continuing to perform favourably.
Citizens
xCitizens’ average credit card portfolio totalled £936 million during
2011, with Core assets comprising 90.2% of the portfolio.
Citizens’ cards business has traditionally adopted conservative
risk strategies compared with the US market and given the
economic climate, has introduced tighter lending criteria and
lower credit limits. These actions have led to improving new
business quality and a business performing better than industry
benchmarks (provided by VISA). The latest available metrics
show the 60+ days delinquency as a percentage of total
outstandings at 2.15% at November 2011 (compared to an
industry figure of 2.45%) and net contractual charge-offs as a
percentage of total outstandings at 2.89% at November 2011
(compared to an industry figure of 3.69%).
xCitizens’ average auto loan portfolio totalled £4.9 billion during
2011, of which 98% is considered Core. £101 million (2%) is Non-
Core and anticipated to run off by 2013. Citizens’ vehicle
financing business lends to US consumers through a network of
4,200 auto dealers in 25 US states. Citizens’ credit policy is
considered conservative, targeting prime customers and has
historically experienced credit losses below those of industry
peers.
xThe net write-off rate on the total auto portfolio fell to 0.18% at 31
December 2011, from 0.34% in 2010. The 30+ days past due
delinquency rate fell to 1.04% at 31 December 2011, from 1.57%
in 2010.
*unaudited
Business review Risk and balance sheet management continued