RBS 2011 Annual Report Download - page 151
Download and view the complete annual report
Please find page 151 of the 2011 RBS annual report below. You can navigate through the pages in the report by either clicking on the pages listed below, or by using the keyword search tool below to find specific information within the annual report.-
 1
1 -
2
-
3
-
4
-
5
-
6
-
7
-
8
-
9
-
10
-
11
-
12
-
13
-
14
-
15
-
16
-
17
-
18
-
19
-
20
-
21
-
22
-
23
-
24
-
25
-
26
-
27
-
28
-
29
-
30
-
31
-
32
-
33
-
34
-
35
-
36
-
37
-
38
-
39
-
40
-
41
-
42
-
43
-
44
-
45
-
46
-
47
-
48
-
49
-
50
-
51
-
52
-
53
-
54
-
55
-
56
-
57
-
58
-
59
-
60
-
61
-
62
-
63
-
64
-
65
-
66
-
67
-
68
-
69
-
70
-
71
-
72
-
73
-
74
-
75
-
76
-
77
-
78
-
79
-
80
-
81
-
82
-
83
-
84
-
85
-
86
-
87
-
88
-
89
-
90
-
91
-
92
-
93
-
94
-
95
-
96
-
97
-
98
-
99
-
100
-
101
-
102
-
103
-
104
-
105
-
106
-
107
-
108
-
109
-
110
-
111
-
112
-
113
-
114
-
115
-
116
-
117
-
118
-
119
-
120
-
121
-
122
-
123
-
124
-
125
-
126
-
127
-
128
-
129
-
130
-
131
-
132
-
133
-
134
-
135
-
136
-
137
-
138
-
139
-
140
-
 141
141 -
 142
142 -
 143
143 -
 144
144 -
 145
145 -
 146
146 -
 147
147 -
 148
148 -
 149
149 -
 150
150 -
 151
151 -
 152
152 -
 153
153 -
 154
154 -
 155
155 -
 156
156 -
 157
157 -
 158
158 -
 159
159 -
 160
160 -
 161
161 -
162
-
163
-
164
-
165
-
166
-
167
-
168
-
169
-
170
-
171
-
172
-
173
-
174
-
175
-
176
-
177
-
178
-
179
-
180
-
181
-
182
-
183
-
184
-
185
-
186
-
187
-
188
-
189
-
190
-
191
-
192
-
193
-
194
-
195
-
196
-
197
-
198
-
199
-
200
-
201
-
202
-
203
-
204
-
205
-
206
-
207
-
208
-
209
-
210
-
211
-
212
-
213
-
214
-
215
-
216
-
217
-
218
-
219
-
220
-
221
-
222
-
223
-
224
-
225
-
226
-
227
-
228
-
229
-
230
-
231
-
232
-
233
-
234
-
235
-
236
-
237
-
238
-
239
-
240
-
241
-
242
-
243
-
244
-
245
-
246
-
247
-
248
-
249
-
250
-
251
-
252
-
253
-
254
-
255
-
256
-
257
-
258
-
259
-
260
-
261
-
262
-
263
-
264
-
265
-
266
-
267
-
268
-
269
-
270
-
271
-
272
-
273
-
274
-
275
-
276
-
277
-
278
-
279
-
280
-
281
-
282
-
283
-
284
-
285
-
286
-
287
-
288
-
289
-
290
-
291
-
292
-
293
-
294
-
295
-
296
-
297
-
298
-
299
-
300
-
301
-
302
-
303
-
304
-
305
-
306
-
307
-
308
-
309
-
310
-
311
-
312
-
313
-
314
-
315
-
316
-
317
-
318
-
319
-
320
-
321
-
322
-
323
-
324
-
325
-
326
-
327
-
328
-
329
-
330
-
331
-
332
-
333
-
334
-
335
-
336
-
337
-
338
-
339
-
340
-
341
-
342
-
343
-
344
-
345
-
346
-
347
-
348
-
349
-
350
-
351
-
352
-
353
-
354
-
355
-
356
-
357
-
358
-
359
-
360
-
361
-
362
-
363
-
364
-
365
-
366
-
367
-
368
-
369
-
370
-
371
-
372
-
373
-
374
-
375
-
376
-
377
-
378
-
379
-
380
-
381
-
382
-
383
-
384
-
385
-
386
-
387
-
388
-
389
-
390
-
391
-
392
-
393
-
394
-
395
-
396
-
397
-
398
-
399
-
400
-
401
-
402
-
403
-
404
-
405
-
406
-
407
-
408
-
409
-
410
-
411
-
412
-
413
-
414
-
415
-
416
-
417
-
418
-
419
-
420
-
421
-
422
-
423
-
424
-
425
-
426
-
427
-
428
-
429
-
430
-
431
-
432
-
433
-
434
-
435
-
436
-
437
-
438
-
439
-
440
-
441
-
442
-
443
-
444
-
445
-
446
-
447
-
448
-
449
-
450
-
451
-
452
-
453
-
454
-
455
-
456
-
457
-
458
-
459
-
460
-
461
-
462
-
463
-
464
-
465
-
466
-
467
-
468
-
469
-
470
-
471
-
472
-
473
-
474
-
475
-
476
-
477
-
478
-
479
-
480
-
481
-
482
-
483
-
484
-
485
-
486
-
487
-
488
-
489
-
490
 |
 |

RBS Group 2011 149
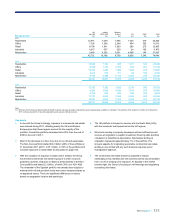
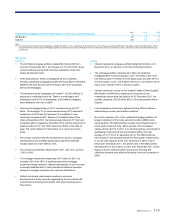
xThe other financial institutions sector comprises traded and non-
traded products and is spread across a wide range of financial
companies including insurance companies, securitisation vehicles,
financial intermediaries including central counterparties (CCPs),
financial guarantors - monolines and credit derivative product
companies (CDPCs) - and unleveraged, hedge and leveraged funds.
The size and asset quality of this portfolio are stable and have not
changed materially since 2010. However, entities in this sector
remain vulnerable to market shocks or contagion from the banking
sector crisis. Credit risk for these sectors is managed through both
the sector concentration and asset and product class frameworks,
with specific sector and product caps introduced where there is a
perception of heightened credit risk, such as with leveraged funds
and insurance holding companies. Additionally, policies were
tightened for riskier products to entities in this portfolio, such as
committed lending, to reduce risks from a customer default. During
the year, a comprehensive securitisation framework was established
to cap the securitisation portfolio and to control concentrations to the
underlying asset classes and originators. The Group is currently
reassessing its risk appetite framework for CCPs to reflect increases
in activity with these entities, as a result of regulatory requirements
for derivatives to be cleared through CCPs. In 2011, the Group
continued to manage down its exposures to monolines and CDPCs
and was successful in commuting trades with entities in this portfolio.
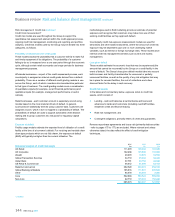
xThe Group’s exposure to the property sector totals £102 billion (a
reduction of 10% during the year), the majority of which is
commercial real estate (refer to page 150 for further detail). The
remainder comprises lending to construction companies, housing
associations and building material companies. The majority of
property exposure (with the exception of Non-Core) is within UK
Corporate (63%). Asset quality in other property sub-sectors
remained stable during the year and whilst there are some material
single name concentrations in the construction sector due to
industry consolidation, overall appetite remains controlled through
the sector concentration limits framework.
xThe exposure to the retail sector attracts heightened scrutiny due to
its cyclical nature. Stress testing has confirmed that the retail sector
has an above average vulnerability to a high UK inflation and
interest rate scenario. Certain sub-sectors have proven less
vulnerable to macroeconomic volatilities (e.g. food and beverage) as
have larger retailers with well established brands and multiple
channel offerings. Total exposure declined 6% during 2011. Despite
recent high profile failures of UK high street retailers, loss
experience on the RBS retail portfolio over 2011 was low, following
the earlier exit from some parts of the portfolio. The portfolio is
generally well diversified by geography and by counterparty.
xThe leisure sector displays weaker credit metrics than the wider
corporate portfolio, in line with the industry trend. Default experience
in hotels and restaurants is particularly high. The Group’s risk
appetite towards the sector is driven by the importance of the leisure
sector to the UK franchise, especially for the UK Corporate division,
but is mitigated through tighter origination policies and guidelines
and a reduction in exposure to high risk sub-sectors. The gaming
sub-sector is subject to specific controls due to its inherent high
credit and reputational risk profile.
xThe Group’s transport sector includes £11.7 billion of asset-backed
exposure to ocean-going vessels. The downturn observed in the
shipping sector since 2008 continued during 2011, with further
pressure on second-hand values and deliveries of new build vessels
into poor markets. A key protection for the Group is the minimum
security covenant. This covenant is tested each quarter on an
individual vessel basis to ensure that prompt remedial action is
taken if values fall significantly below agreed loan coverage ratios.
At 31 December 2011, 1% of the Group’s exposure to this sector
was in Watchlist Red.
xExposure to the healthcare and education sectors is included in the
business services sector and totalled £13.4 billion at year-end. It is
mostly UK focused and is heavily biased towards the health sector,
which represents 74% of the exposure. The sector has performed
well despite the difficult economic conditions but there are
continuing uncertainties over the impact of Government spending
reductions. Key concerns remain over the nursing home sub-sector,
where the lower end of the elderly care home book saw an
increased rate of customers being placed on Watchlist and higher
defaults over 2011. Actions were taken to rebalance the portfolio
towards the stronger operators.