RBS 2011 Annual Report Download - page 18
Download and view the complete annual report
Please find page 18 of the 2011 RBS annual report below. You can navigate through the pages in the report by either clicking on the pages listed below, or by using the keyword search tool below to find specific information within the annual report.-
 1
1 -
2
-
3
-
4
-
5
-
6
-
7
-
 8
8 -
 9
9 -
 10
10 -
 11
11 -
 12
12 -
 13
13 -
 14
14 -
 15
15 -
 16
16 -
 17
17 -
 18
18 -
 19
19 -
 20
20 -
 21
21 -
 22
22 -
 23
23 -
 24
24 -
 25
25 -
 26
26 -
 27
27 -
 28
28 -
29
-
30
-
31
-
32
-
33
-
34
-
35
-
36
-
37
-
38
-
39
-
40
-
41
-
42
-
43
-
44
-
45
-
46
-
47
-
48
-
49
-
50
-
51
-
52
-
53
-
54
-
55
-
56
-
57
-
58
-
59
-
60
-
61
-
62
-
63
-
64
-
65
-
66
-
67
-
68
-
69
-
70
-
71
-
72
-
73
-
74
-
75
-
76
-
77
-
78
-
79
-
80
-
81
-
82
-
83
-
84
-
85
-
86
-
87
-
88
-
89
-
90
-
91
-
92
-
93
-
94
-
95
-
96
-
97
-
98
-
99
-
100
-
101
-
102
-
103
-
104
-
105
-
106
-
107
-
108
-
109
-
110
-
111
-
112
-
113
-
114
-
115
-
116
-
117
-
118
-
119
-
120
-
121
-
122
-
123
-
124
-
125
-
126
-
127
-
128
-
129
-
130
-
131
-
132
-
133
-
134
-
135
-
136
-
137
-
138
-
139
-
140
-
141
-
142
-
143
-
144
-
145
-
146
-
147
-
148
-
149
-
150
-
151
-
152
-
153
-
154
-
155
-
156
-
157
-
158
-
159
-
160
-
161
-
162
-
163
-
164
-
165
-
166
-
167
-
168
-
169
-
170
-
171
-
172
-
173
-
174
-
175
-
176
-
177
-
178
-
179
-
180
-
181
-
182
-
183
-
184
-
185
-
186
-
187
-
188
-
189
-
190
-
191
-
192
-
193
-
194
-
195
-
196
-
197
-
198
-
199
-
200
-
201
-
202
-
203
-
204
-
205
-
206
-
207
-
208
-
209
-
210
-
211
-
212
-
213
-
214
-
215
-
216
-
217
-
218
-
219
-
220
-
221
-
222
-
223
-
224
-
225
-
226
-
227
-
228
-
229
-
230
-
231
-
232
-
233
-
234
-
235
-
236
-
237
-
238
-
239
-
240
-
241
-
242
-
243
-
244
-
245
-
246
-
247
-
248
-
249
-
250
-
251
-
252
-
253
-
254
-
255
-
256
-
257
-
258
-
259
-
260
-
261
-
262
-
263
-
264
-
265
-
266
-
267
-
268
-
269
-
270
-
271
-
272
-
273
-
274
-
275
-
276
-
277
-
278
-
279
-
280
-
281
-
282
-
283
-
284
-
285
-
286
-
287
-
288
-
289
-
290
-
291
-
292
-
293
-
294
-
295
-
296
-
297
-
298
-
299
-
300
-
301
-
302
-
303
-
304
-
305
-
306
-
307
-
308
-
309
-
310
-
311
-
312
-
313
-
314
-
315
-
316
-
317
-
318
-
319
-
320
-
321
-
322
-
323
-
324
-
325
-
326
-
327
-
328
-
329
-
330
-
331
-
332
-
333
-
334
-
335
-
336
-
337
-
338
-
339
-
340
-
341
-
342
-
343
-
344
-
345
-
346
-
347
-
348
-
349
-
350
-
351
-
352
-
353
-
354
-
355
-
356
-
357
-
358
-
359
-
360
-
361
-
362
-
363
-
364
-
365
-
366
-
367
-
368
-
369
-
370
-
371
-
372
-
373
-
374
-
375
-
376
-
377
-
378
-
379
-
380
-
381
-
382
-
383
-
384
-
385
-
386
-
387
-
388
-
389
-
390
-
391
-
392
-
393
-
394
-
395
-
396
-
397
-
398
-
399
-
400
-
401
-
402
-
403
-
404
-
405
-
406
-
407
-
408
-
409
-
410
-
411
-
412
-
413
-
414
-
415
-
416
-
417
-
418
-
419
-
420
-
421
-
422
-
423
-
424
-
425
-
426
-
427
-
428
-
429
-
430
-
431
-
432
-
433
-
434
-
435
-
436
-
437
-
438
-
439
-
440
-
441
-
442
-
443
-
444
-
445
-
446
-
447
-
448
-
449
-
450
-
451
-
452
-
453
-
454
-
455
-
456
-
457
-
458
-
459
-
460
-
461
-
462
-
463
-
464
-
465
-
466
-
467
-
468
-
469
-
470
-
471
-
472
-
473
-
474
-
475
-
476
-
477
-
478
-
479
-
480
-
481
-
482
-
483
-
484
-
485
-
486
-
487
-
488
-
489
-
490
 |
 |
16 RBS Group 2011
Keep up with our latest
economic research and
analysis at
www.rbs.com/economics
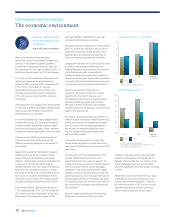
When economies are emerging from
recessions rooted in high levels of debt and
stresses in the financial system, growth is
slower than in the typical recovery. That was
the experience of our major markets in 2011. It
is what we should expect in 2012 and beyond.
In the UK, growth weakened. Total economic
activity, as measured by gross domestic
product (GDP), grew by 0.8% compared with
2.1% in 2010. At the start of the year,
expectations had been more positive, the
consensus forecast for growth having been
2.1%. Yet the year ended with the economy
contracting.
Unemployment rose sharply, from less than 8%
in mid-year to 8.4% in December. Wage growth
was subdued and inflation reduced the
spending power of earnings.
In commercial property, values edged higher,
finishing the year up 2%. Strong performance
in prime markets, particularly central London
was the main source of gains. Again, however,
momentum slowed towards the end of the year.
Housing market activity remained subdued.
Prices probably fell slightly although the
different measures disagree on the extent of
the change.
Against this backdrop, the Bank of England
continued its ultra-loose monetary policy
stance. Despite persistently above-target
inflation, interest rates remained unchanged at
a record low of 0.5%, the Bank judging
elevated inflation to be the result of temporary
factors. In fact, its greater concern was that
the weak economy would cause inflation to be
too low and in October, the Monetary Policy
Committee announced that it would increase
its asset purchase programme by £75 billion.
In the United States, GDP growth slowed to
1.7% compared with 3.0% in 2010. Unlike the
UK, however, growth accelerated as the year
progressed. Unemployment began to fall,
although at 8.5% in December it was high
compared with previous recoveries.
Housing remained a drag anchor. Prices fell by
around a further 4% and were almost a third
below their peak level. Sales volumes were
subdued and an overhang of properties on
which borrowers had defaulted remained.
Judging that the pace of recovery was too slow
to reduce unemployment sufficiently, the
Federal Reserve tried to stimulate the economy
in the third quarter with unconventional
measures designed to push down medium to
long-term interest rates. It also said it expected
to keep the Fed Funds rate, its main policy rate,
at its current low level at least until mid-2013.
Ireland emerged from three years of
recession. The export sector led modest
growth in the first half of the year, as it
benefited from the boost to competitiveness
delivered by falling wages, and stronger
demand in some of Ireland’s main markets.
However, the economy appears to have shrunk
again in the second half.
For Ireland, gross national product (GNP) is a
better measure of people’s material well-being.
It reflects the income residents receive rather
than the value of the incomes generated in
the country, an important distinction when
there is a large foreign-owned sector that
remits profits overseas.
Unemployment averaged more than 14%.
House prices dropped to a point where they
were close to 50% below their peak level at the
year’s end.
Looming over 2011 and prospects for 2012
was the likelihood that some euro area
governments will not be able to repay in full
monies they have borrowed. Uncertainty about
how this problem will be solved damaged
confidence. The policy prescribed for highly
indebted countries, fiscal austerity, made their
growth prospects worse because there are no
compensating interest or exchange rate gains
in a currency union. By the end of the year, the
euro area was in recession, exacerbating the
debt problem.
Europe’s leaders avoided both a disorderly
default and a break-up of the euro area.
However, it will take political will and public
support to manage the immediate risk of
defaults and to tackle the root causes of the
acute challenges that have accumulated
since the establishment of the single currency
in 1999.
Absent the worst outcome for the euro area –
a default that cannot be contained in one
country and its banking system – growth in
our main economies in 2012 will be slow as
households and governments continue to
labour under substantial debt burdens.
Our business and our strategy
The economic environment
15
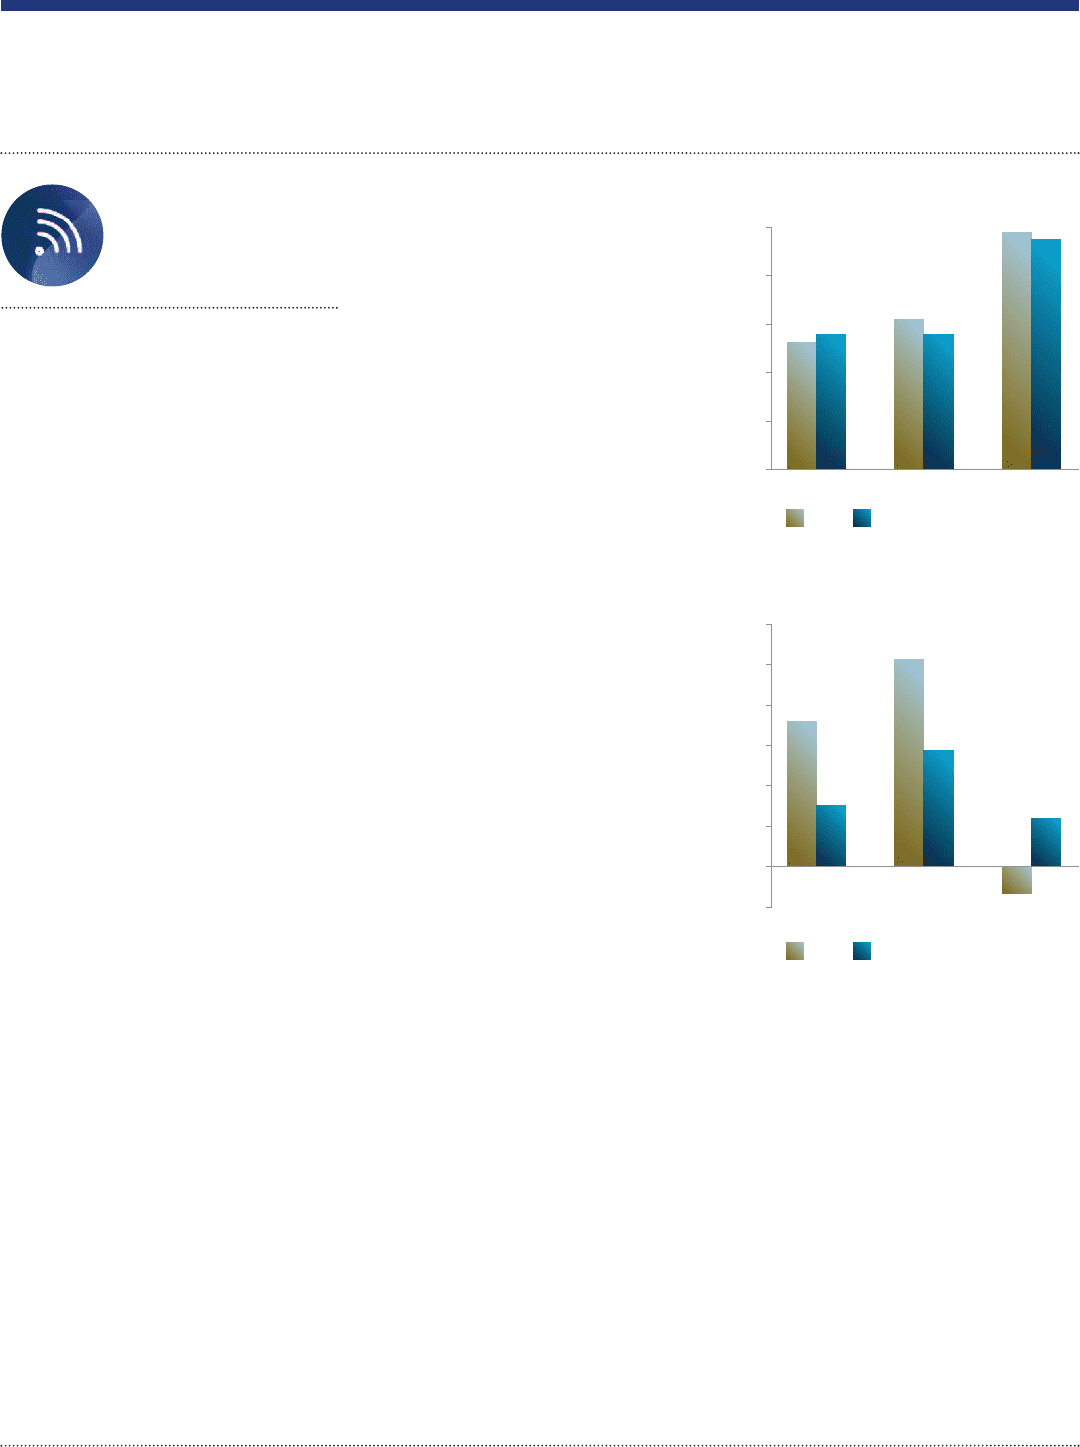
12
9
6
3
0
UK US Republic
of Ireland
2010
Sources: National statistical agencies
2011
Unemployment rates, %, December
Real GDP growth rates, %
3.0
2.5
2.0
1.5
1.0
0.5
0
-0.5
UK US Republic
of Ireland
2010
Sources: National statistical agencies
Note: Republic of Ireland is first three quarters of 2011
versus first three quarters of 2010
2011