RBS 2011 Annual Report Download - page 374
Download and view the complete annual report
Please find page 374 of the 2011 RBS annual report below. You can navigate through the pages in the report by either clicking on the pages listed below, or by using the keyword search tool below to find specific information within the annual report.-
 1
1 -
2
-
3
-
4
-
5
-
6
-
7
-
8
-
9
-
10
-
11
-
12
-
13
-
14
-
15
-
16
-
17
-
18
-
19
-
20
-
21
-
22
-
23
-
24
-
25
-
26
-
27
-
28
-
29
-
30
-
31
-
32
-
33
-
34
-
35
-
36
-
37
-
38
-
39
-
40
-
41
-
42
-
43
-
44
-
45
-
46
-
47
-
48
-
49
-
50
-
51
-
52
-
53
-
54
-
55
-
56
-
57
-
58
-
59
-
60
-
61
-
62
-
63
-
64
-
65
-
66
-
67
-
68
-
69
-
70
-
71
-
72
-
73
-
74
-
75
-
76
-
77
-
78
-
79
-
80
-
81
-
82
-
83
-
84
-
85
-
86
-
87
-
88
-
89
-
90
-
91
-
92
-
93
-
94
-
95
-
96
-
97
-
98
-
99
-
100
-
101
-
102
-
103
-
104
-
105
-
106
-
107
-
108
-
109
-
110
-
111
-
112
-
113
-
114
-
115
-
116
-
117
-
118
-
119
-
120
-
121
-
122
-
123
-
124
-
125
-
126
-
127
-
128
-
129
-
130
-
131
-
132
-
133
-
134
-
135
-
136
-
137
-
138
-
139
-
140
-
141
-
142
-
143
-
144
-
145
-
146
-
147
-
148
-
149
-
150
-
151
-
152
-
153
-
154
-
155
-
156
-
157
-
158
-
159
-
160
-
161
-
162
-
163
-
164
-
165
-
166
-
167
-
168
-
169
-
170
-
171
-
172
-
173
-
174
-
175
-
176
-
177
-
178
-
179
-
180
-
181
-
182
-
183
-
184
-
185
-
186
-
187
-
188
-
189
-
190
-
191
-
192
-
193
-
194
-
195
-
196
-
197
-
198
-
199
-
200
-
201
-
202
-
203
-
204
-
205
-
206
-
207
-
208
-
209
-
210
-
211
-
212
-
213
-
214
-
215
-
216
-
217
-
218
-
219
-
220
-
221
-
222
-
223
-
224
-
225
-
226
-
227
-
228
-
229
-
230
-
231
-
232
-
233
-
234
-
235
-
236
-
237
-
238
-
239
-
240
-
241
-
242
-
243
-
244
-
245
-
246
-
247
-
248
-
249
-
250
-
251
-
252
-
253
-
254
-
255
-
256
-
257
-
258
-
259
-
260
-
261
-
262
-
263
-
264
-
265
-
266
-
267
-
268
-
269
-
270
-
271
-
272
-
273
-
274
-
275
-
276
-
277
-
278
-
279
-
280
-
281
-
282
-
283
-
284
-
285
-
286
-
287
-
288
-
289
-
290
-
291
-
292
-
293
-
294
-
295
-
296
-
297
-
298
-
299
-
300
-
301
-
302
-
303
-
304
-
305
-
306
-
307
-
308
-
309
-
310
-
311
-
312
-
313
-
314
-
315
-
316
-
317
-
318
-
319
-
320
-
321
-
322
-
323
-
324
-
325
-
326
-
327
-
328
-
329
-
330
-
331
-
332
-
333
-
334
-
335
-
336
-
337
-
338
-
339
-
340
-
341
-
342
-
343
-
344
-
345
-
346
-
347
-
348
-
349
-
350
-
351
-
352
-
353
-
354
-
355
-
356
-
357
-
358
-
359
-
360
-
361
-
362
-
363
-
 364
364 -
 365
365 -
 366
366 -
 367
367 -
 368
368 -
 369
369 -
 370
370 -
 371
371 -
 372
372 -
 373
373 -
 374
374 -
 375
375 -
 376
376 -
 377
377 -
 378
378 -
 379
379 -
 380
380 -
 381
381 -
 382
382 -
 383
383 -
 384
384 -
385
-
386
-
387
-
388
-
389
-
390
-
391
-
392
-
393
-
394
-
395
-
396
-
397
-
398
-
399
-
400
-
401
-
402
-
403
-
404
-
405
-
406
-
407
-
408
-
409
-
410
-
411
-
412
-
413
-
414
-
415
-
416
-
417
-
418
-
419
-
420
-
421
-
422
-
423
-
424
-
425
-
426
-
427
-
428
-
429
-
430
-
431
-
432
-
433
-
434
-
435
-
436
-
437
-
438
-
439
-
440
-
441
-
442
-
443
-
444
-
445
-
446
-
447
-
448
-
449
-
450
-
451
-
452
-
453
-
454
-
455
-
456
-
457
-
458
-
459
-
460
-
461
-
462
-
463
-
464
-
465
-
466
-
467
-
468
-
469
-
470
-
471
-
472
-
473
-
474
-
475
-
476
-
477
-
478
-
479
-
480
-
481
-
482
-
483
-
484
-
485
-
486
-
487
-
488
-
489
-
490
 |
 |

372 RBS Group 2011
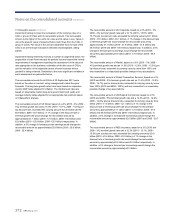
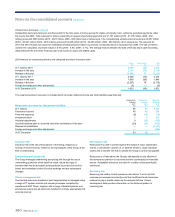
17 Intangible assets continued
Impairment testing involves the comparison of the carrying value of a
CGU or group of CGUs with its recoverable amount. The recoverable
amount is the higher of the unit's fair value and its value in use. Value in
use is the present value of expected future cash flows from the CGU or
group of CGUs. Fair value is the amount obtainable from the sale of the
CGU in an arm's length transaction between knowledgeable, willing
parties.
Impairment testing inherently involves a number of judgmental areas: the
preparation of cash flow forecasts for periods that are beyond the normal
requirements of management reporting; the assessment of the discount
rate appropriate to the business; estimation of the fair value of CGUs;
and the valuation of the separable assets of each business whose
goodwill is being reviewed. Sensitivity to the more significant variables in
each assessment are presented below.
The recoverable amounts for all CGUs at 30 September 2011 were
based on the value in use test, using management's latest five-year
forecasts. The long-term growth rates have been based on respective
country GDP rates adjusted for inflation. The risk discount rates are
based on observable market long-term government bond yields and
average industry betas adjusted for an appropriate risk premium based
on independent analysis.
The recoverable amount of UK Retail, based on a 3% (2010 - 3%; 2009 -
4%) terminal growth rate and a 14.0% (2010 - 15.7%; 2009 - 14.6%) pre
tax discount rate, exceeded the carrying amount by £5.5 billion (2010 -
£6.9 billion; 2009 - £0.7 billion). A 1% change in the discount rate or
terminal growth rate would change the recoverable amount by
approximately £1.1 billion (2010 - £1.5 billion; 2009 - £0.9 billion) and
£0.6 billion (2010 - £0.9 billion; 2009 - £0.5 billion) respectively. In
addition, a 5% change in forecast pre tax earnings would change the
recoverable amount by approximately £0.8 billion (2010 - £0.9 billion;
2009 - £0.4 billion).
The recoverable amount of UK Corporate, based on a 3% (2010 - 3%;
2009 - 4%) terminal growth rate and a 14.1% (2010 - 15.6%; 2009 -
15.1%) pre tax discount rate, exceeded its carrying value by £2.1 billion
(2010 - £5.3 billion; 2009 - £6.1 billion). A 1% change in the discount rate
or terminal growth rate would change the recoverable amount by
approximately £1.1 billion (2010 - £1.6 billion; 2009 - £1.4 billion) and
£0.5 billion (2010 and 2009 - £0.9 billion) respectively. In addition, a 5%
change in forecast pre tax earnings would change the recoverable
amount by approximately £0.8 billion (2010 - £1.0 billion; 2009 - £0.8
billion).
The recoverable amount of Wealth, based on a 3% (2010 - 3%; 2009 -
4%) terminal growth rate and an 11.0% (2010 - 12.0%; 2009 - 15.3%) pre
tax discount rate, exceeded its carrying value by more than 100% and
was insensitive to a reasonably possible change in key assumptions.
The recoverable amount of Global Transaction Services, based on a 3%
(2010 and 2009 - 3%) terminal growth rate and an 11.4% (2010 - 12.8%;
2009 - 16.7%) pre tax discount rate, exceeded its carrying value by more
than 100% (2010 and 2009 - 100%) and was insensitive to a reasonably
possible change in key assumptions.
The recoverable amount of US Retail & Commercial, based on a 5%
(2010 and 2009 - 5%) terminal growth rate and a 14.4% (2010 - 14.9%;
2009 - 14.8%) pre tax discount rate, exceeded its carrying value by £0.2
billion (2010 - £1.6 billion; 2009 - £2.1 billion). A 1% change in the
discount rate or terminal growth rate would change the recoverable
amount by approximately £1.1 billion (2010 - £1.6 billion; 2009 - £1.0
billion) and £0.5 billion (2010 and 2009 - £0.8 billion) respectively. In
addition, a 5% change in forecast pre tax earnings would change the
recoverable amount by approximately £0.6 billion (2010 and 2009 - £0.7
billion).
The recoverable amount of RBS Insurance, based on a 3% (2010 and
2009 - 3%) terminal growth rate and a 12.3% (2010 - 13.1%; 2009 -
13.9%) pre tax discount rate, exceeded the carrying amount by £0.8
billion (2010 - £2.4 billion; 2009 - £3.0 billion). A 1% change in the
discount rate or terminal growth rate would change the recoverable
amount by approximately £0.5 billion and £0.2 billion respectively. In
addition, a 5% change in forecast pre tax earnings would change the
recoverable amount by approximately £0.3 billion.
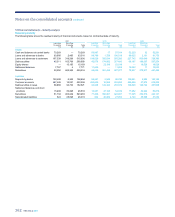
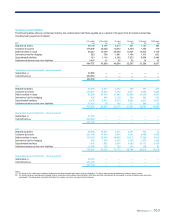
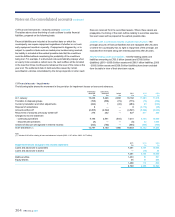
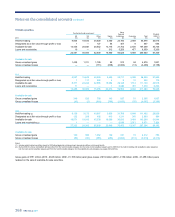
Notes on the consolidated accounts continued