RBS 2011 Annual Report Download - page 157
Download and view the complete annual report
Please find page 157 of the 2011 RBS annual report below. You can navigate through the pages in the report by either clicking on the pages listed below, or by using the keyword search tool below to find specific information within the annual report.-
 1
1 -
2
-
3
-
4
-
5
-
6
-
7
-
8
-
9
-
10
-
11
-
12
-
13
-
14
-
15
-
16
-
17
-
18
-
19
-
20
-
21
-
22
-
23
-
24
-
25
-
26
-
27
-
28
-
29
-
30
-
31
-
32
-
33
-
34
-
35
-
36
-
37
-
38
-
39
-
40
-
41
-
42
-
43
-
44
-
45
-
46
-
47
-
48
-
49
-
50
-
51
-
52
-
53
-
54
-
55
-
56
-
57
-
58
-
59
-
60
-
61
-
62
-
63
-
64
-
65
-
66
-
67
-
68
-
69
-
70
-
71
-
72
-
73
-
74
-
75
-
76
-
77
-
78
-
79
-
80
-
81
-
82
-
83
-
84
-
85
-
86
-
87
-
88
-
89
-
90
-
91
-
92
-
93
-
94
-
95
-
96
-
97
-
98
-
99
-
100
-
101
-
102
-
103
-
104
-
105
-
106
-
107
-
108
-
109
-
110
-
111
-
112
-
113
-
114
-
115
-
116
-
117
-
118
-
119
-
120
-
121
-
122
-
123
-
124
-
125
-
126
-
127
-
128
-
129
-
130
-
131
-
132
-
133
-
134
-
135
-
136
-
137
-
138
-
139
-
140
-
141
-
142
-
143
-
144
-
145
-
146
-
 147
147 -
 148
148 -
 149
149 -
 150
150 -
 151
151 -
 152
152 -
 153
153 -
 154
154 -
 155
155 -
 156
156 -
 157
157 -
 158
158 -
 159
159 -
 160
160 -
 161
161 -
 162
162 -
 163
163 -
 164
164 -
 165
165 -
 166
166 -
 167
167 -
168
-
169
-
170
-
171
-
172
-
173
-
174
-
175
-
176
-
177
-
178
-
179
-
180
-
181
-
182
-
183
-
184
-
185
-
186
-
187
-
188
-
189
-
190
-
191
-
192
-
193
-
194
-
195
-
196
-
197
-
198
-
199
-
200
-
201
-
202
-
203
-
204
-
205
-
206
-
207
-
208
-
209
-
210
-
211
-
212
-
213
-
214
-
215
-
216
-
217
-
218
-
219
-
220
-
221
-
222
-
223
-
224
-
225
-
226
-
227
-
228
-
229
-
230
-
231
-
232
-
233
-
234
-
235
-
236
-
237
-
238
-
239
-
240
-
241
-
242
-
243
-
244
-
245
-
246
-
247
-
248
-
249
-
250
-
251
-
252
-
253
-
254
-
255
-
256
-
257
-
258
-
259
-
260
-
261
-
262
-
263
-
264
-
265
-
266
-
267
-
268
-
269
-
270
-
271
-
272
-
273
-
274
-
275
-
276
-
277
-
278
-
279
-
280
-
281
-
282
-
283
-
284
-
285
-
286
-
287
-
288
-
289
-
290
-
291
-
292
-
293
-
294
-
295
-
296
-
297
-
298
-
299
-
300
-
301
-
302
-
303
-
304
-
305
-
306
-
307
-
308
-
309
-
310
-
311
-
312
-
313
-
314
-
315
-
316
-
317
-
318
-
319
-
320
-
321
-
322
-
323
-
324
-
325
-
326
-
327
-
328
-
329
-
330
-
331
-
332
-
333
-
334
-
335
-
336
-
337
-
338
-
339
-
340
-
341
-
342
-
343
-
344
-
345
-
346
-
347
-
348
-
349
-
350
-
351
-
352
-
353
-
354
-
355
-
356
-
357
-
358
-
359
-
360
-
361
-
362
-
363
-
364
-
365
-
366
-
367
-
368
-
369
-
370
-
371
-
372
-
373
-
374
-
375
-
376
-
377
-
378
-
379
-
380
-
381
-
382
-
383
-
384
-
385
-
386
-
387
-
388
-
389
-
390
-
391
-
392
-
393
-
394
-
395
-
396
-
397
-
398
-
399
-
400
-
401
-
402
-
403
-
404
-
405
-
406
-
407
-
408
-
409
-
410
-
411
-
412
-
413
-
414
-
415
-
416
-
417
-
418
-
419
-
420
-
421
-
422
-
423
-
424
-
425
-
426
-
427
-
428
-
429
-
430
-
431
-
432
-
433
-
434
-
435
-
436
-
437
-
438
-
439
-
440
-
441
-
442
-
443
-
444
-
445
-
446
-
447
-
448
-
449
-
450
-
451
-
452
-
453
-
454
-
455
-
456
-
457
-
458
-
459
-
460
-
461
-
462
-
463
-
464
-
465
-
466
-
467
-
468
-
469
-
470
-
471
-
472
-
473
-
474
-
475
-
476
-
477
-
478
-
479
-
480
-
481
-
482
-
483
-
484
-
485
-
486
-
487
-
488
-
489
-
490
 |
 |

RBS Group 2011 155
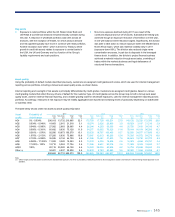
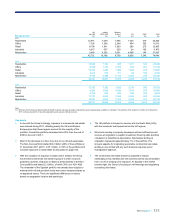
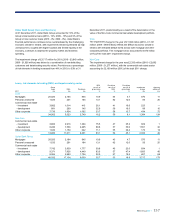
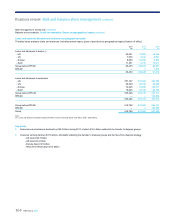
Residential mortgages which are three months or more in arrears (by volume) 2011
%
2010
%
2009
%
UK Retail (1) 1.6 1.7 1.6
Citizens 2.0 1.4 1.5
Note:
(1) The ‘One Account’ current account mortgage is excluded (£5.4 billion - 5.6% of assets) at 31 December 2011, 0.9% of these accounts were 90 days continually in excess of the limit (2010 - 0.8%).
Consistent with the way the Council of Mortgage Lenders publishes member arrears information, the 3+ months arrears rate now excludes accounts in repossession and cases with shortfalls post
property sale.
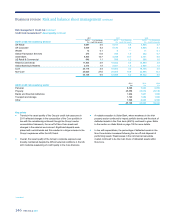
Key points
UK Retail
xThe UK Retail mortgage portfolio totalled £96.4 billion (98.6% in
Core) at 31 December 2011, an increase of 4.1% from 2010, due to
continued strong sales growth and lower redemption rates from
before the financial crisis.
xOf the total portfolio, 98.6% is designated as Core business,
primarily comprising mortgages branded the Royal Bank of Scotland,
NatWest, the One Account and First Active. Non-Core comprises
Direct Line Mortgages.
xThe assets are prime mortgages and include 7.2% (£6.9 billion) of
exposure to residential buy-to-let. There is a small legacy self-
certification book (0.3% of total assets). Self-certified mortgages
were withdrawn from sale in 2004.
xGross new mortgage lending in 2011 remained strong at £14.7
billion. The average LTV for new business during 2011 declined in
comparison to 2010 and the maximum LTV available to new
customers remained at 90%. Based on the Halifax House Price
index at September 2011, the book average indexed LTV improved
marginally when compared to December 2010, with the proportion of
balances with an LTV over 100% also lower. Refer to the table on
page 159, which details LTV information on a volume and value
basis.
xThe arrears rate (more than three payments in arrears, excluding
repossessions and shortfalls post property sale) has remained
broadly stable since late 2009 at 1.6%.
xThe number of properties repossessed in 2011 was 1,671, up from
1,392 in 2010.
xThe mortgage impairment charge was £187 million for 2011, an
increase of 2% from 2010. A significant part of the mortgage
impairment charge related to reduced expectations of cash recovery
on already defaulted debt. It also included an additional provision
charge for mortgage customers who received forbearance.
xDefault and arrears rates remain sensitive to economic
developments and are currently supported by the low interest rate
environment and strong book growth, with recent business yet to
fully mature.
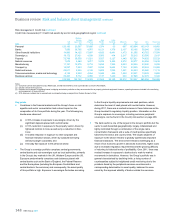
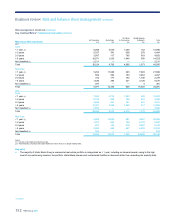
Citizens
xCitizens’ residential mortgage portfolio totalled £23.8 billion at 31
December 2011, a reduction of 3% from 2010 (£24.6 billion).
xThe mortgage portfolio comprises £6.4 billion of residential
mortgages (99% in first lien position: Core - £5.8 billion; Non-Core -
£0.6 billion) and £17.4 billion of home equity loans and lines (41% in
first lien position: Core - £14.9 billion; Non-Core - £2.5 billion). Home
equity Core consists of 47% in first lien position.
xCitizens continues to focus on the ‘footprint’ states of New England,
Mid Atlantic and Mid West, targeting low risk products and
maintaining conservative risk policies. At 31 December 2011, the
portfolio consisted of £19.5 billion (82% of the total portfolio) within
footprint.
xLoan acceptance criteria were tightened during 2009 to address
deteriorating economic and market conditions.
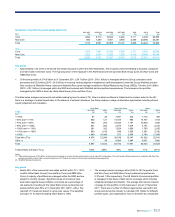
xNon-Core comprises 13% of the residential mortgage portfolio. Its
largest component (74%) is the serviced by others (SBO) home
equity portfolio. The SBO portfolio consists of purchased pools of
home equity loans and lines, which resulted in an annualised
charge-off rate of 8.7% in 2011. It is characterised by out-of-footprint
geographies, high second lien concentration (95%) and high
average LTV (113% at 31 December 2011). The SBO book has
been closed to new purchases since the third quarter of 2007 and is
in run-off, with exposure down from £2.8 billion in 2010, to £2.3
billion at 31 December 2011. The arrears rate of the SBO portfolio
decreased from 3.0% in 2010, to 2.3% at 31 December 2011, as the
legacy of poorer assets receded, and account servicing and
collections became more effective following a servicer conversion in
2009.