RBS 2011 Annual Report Download - page 436
Download and view the complete annual report
Please find page 436 of the 2011 RBS annual report below. You can navigate through the pages in the report by either clicking on the pages listed below, or by using the keyword search tool below to find specific information within the annual report.-
 1
1 -
2
-
3
-
4
-
5
-
6
-
7
-
8
-
9
-
10
-
11
-
12
-
13
-
14
-
15
-
16
-
17
-
18
-
19
-
20
-
21
-
22
-
23
-
24
-
25
-
26
-
27
-
28
-
29
-
30
-
31
-
32
-
33
-
34
-
35
-
36
-
37
-
38
-
39
-
40
-
41
-
42
-
43
-
44
-
45
-
46
-
47
-
48
-
49
-
50
-
51
-
52
-
53
-
54
-
55
-
56
-
57
-
58
-
59
-
60
-
61
-
62
-
63
-
64
-
65
-
66
-
67
-
68
-
69
-
70
-
71
-
72
-
73
-
74
-
75
-
76
-
77
-
78
-
79
-
80
-
81
-
82
-
83
-
84
-
85
-
86
-
87
-
88
-
89
-
90
-
91
-
92
-
93
-
94
-
95
-
96
-
97
-
98
-
99
-
100
-
101
-
102
-
103
-
104
-
105
-
106
-
107
-
108
-
109
-
110
-
111
-
112
-
113
-
114
-
115
-
116
-
117
-
118
-
119
-
120
-
121
-
122
-
123
-
124
-
125
-
126
-
127
-
128
-
129
-
130
-
131
-
132
-
133
-
134
-
135
-
136
-
137
-
138
-
139
-
140
-
141
-
142
-
143
-
144
-
145
-
146
-
147
-
148
-
149
-
150
-
151
-
152
-
153
-
154
-
155
-
156
-
157
-
158
-
159
-
160
-
161
-
162
-
163
-
164
-
165
-
166
-
167
-
168
-
169
-
170
-
171
-
172
-
173
-
174
-
175
-
176
-
177
-
178
-
179
-
180
-
181
-
182
-
183
-
184
-
185
-
186
-
187
-
188
-
189
-
190
-
191
-
192
-
193
-
194
-
195
-
196
-
197
-
198
-
199
-
200
-
201
-
202
-
203
-
204
-
205
-
206
-
207
-
208
-
209
-
210
-
211
-
212
-
213
-
214
-
215
-
216
-
217
-
218
-
219
-
220
-
221
-
222
-
223
-
224
-
225
-
226
-
227
-
228
-
229
-
230
-
231
-
232
-
233
-
234
-
235
-
236
-
237
-
238
-
239
-
240
-
241
-
242
-
243
-
244
-
245
-
246
-
247
-
248
-
249
-
250
-
251
-
252
-
253
-
254
-
255
-
256
-
257
-
258
-
259
-
260
-
261
-
262
-
263
-
264
-
265
-
266
-
267
-
268
-
269
-
270
-
271
-
272
-
273
-
274
-
275
-
276
-
277
-
278
-
279
-
280
-
281
-
282
-
283
-
284
-
285
-
286
-
287
-
288
-
289
-
290
-
291
-
292
-
293
-
294
-
295
-
296
-
297
-
298
-
299
-
300
-
301
-
302
-
303
-
304
-
305
-
306
-
307
-
308
-
309
-
310
-
311
-
312
-
313
-
314
-
315
-
316
-
317
-
318
-
319
-
320
-
321
-
322
-
323
-
324
-
325
-
326
-
327
-
328
-
329
-
330
-
331
-
332
-
333
-
334
-
335
-
336
-
337
-
338
-
339
-
340
-
341
-
342
-
343
-
344
-
345
-
346
-
347
-
348
-
349
-
350
-
351
-
352
-
353
-
354
-
355
-
356
-
357
-
358
-
359
-
360
-
361
-
362
-
363
-
364
-
365
-
366
-
367
-
368
-
369
-
370
-
371
-
372
-
373
-
374
-
375
-
376
-
377
-
378
-
379
-
380
-
381
-
382
-
383
-
384
-
385
-
386
-
387
-
388
-
389
-
390
-
391
-
392
-
393
-
394
-
395
-
396
-
397
-
398
-
399
-
400
-
401
-
402
-
403
-
404
-
405
-
406
-
407
-
408
-
409
-
410
-
411
-
412
-
413
-
414
-
415
-
416
-
417
-
418
-
419
-
420
-
421
-
422
-
423
-
424
-
425
-
 426
426 -
 427
427 -
 428
428 -
 429
429 -
 430
430 -
 431
431 -
 432
432 -
 433
433 -
 434
434 -
 435
435 -
 436
436 -
 437
437 -
 438
438 -
 439
439 -
 440
440 -
 441
441 -
 442
442 -
 443
443 -
 444
444 -
 445
445 -
 446
446 -
447
-
448
-
449
-
450
-
451
-
452
-
453
-
454
-
455
-
456
-
457
-
458
-
459
-
460
-
461
-
462
-
463
-
464
-
465
-
466
-
467
-
468
-
469
-
470
-
471
-
472
-
473
-
474
-
475
-
476
-
477
-
478
-
479
-
480
-
481
-
482
-
483
-
484
-
485
-
486
-
487
-
488
-
489
-
490
 |
 |

434 RBS Group 2011
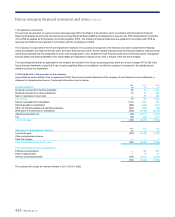
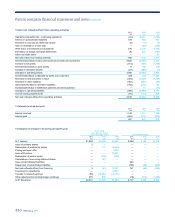
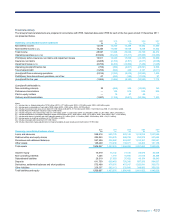
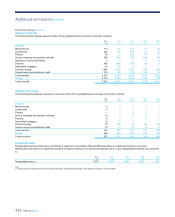
Financial summary continued
Other financial data 2011 2010 2009 2008 2007
(Loss)/earnings per ordinary and B share from continuing operations - pence (1) (1.8) (0.5) (6.3) (146.2) 64.0
Diluted (loss)/earnings per ordinary and B share from continuing operations - pence (1,2) (1.8) (0.5) (6.3) (146.2) 63.4
Adjusted earnings/(loss) per ordinary and B share - pence 0.2 0.5 (13.0) (48.7) 63.8
Dividends per ordinary share - pence (1) —
— — 19.3 27.0
Dividend payout ratio (3) — — — — 43%
Share price per ordinary share at year end - £ 0.20 0.39 0.29 0.49 3.72
Market capitalisation at year end - £bn 22.3 42.8 31.4 19.5 44.4
Net asset value per ordinary and B share - £ 0.64 0.64 0.65 1.15 3.74
Return on average total assets (4) (0.13%) (0.07%) (0.18%) (1.19%) 0.65%
Return on average ordinary and B shareholders' equity (5) (2.9%) (0.7%) (7.2%) (50.1%) 18.7%
Adjusted return on average ordinary and B shareholders' equity (6) 0.3% 0.8% (14.8%) (17.3%) 18.6%
Average owners' equity as a percentage of average total assets 4.9% 4.6% 2.8% 2.9% 3.9%
Risk asset ratio - Tier 1 13.0% 12.9% 14.1% 10.0% 7.3%
Risk asset ratio - Total 13.8% 14.0% 16.1% 14.1% 11.2%
Ratio of earnings to combined fixed charges and preference share dividends (7)
-including interest on deposits 0.91 0.94 0.75 0.05 1.45
- excluding interest on deposits 0.25 0.38 (0.30) (7.80) 5.73
Ratio of earnings to fixed charges only (7)
-including interest on deposits 0.91 0.95 0.80 0.05 1.47
- excluding interest on deposits 0.25 0.44 (0.46) (9.74) 6.53
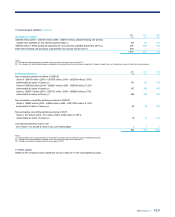
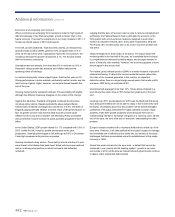
Notes:
(1) The number of ordinary shares in issue in 2008 and 2007 were adjusted retrospectively for the bonus element of the rights issue completed in June 2008 and the capitalisation issue in September
2008.
(2) None of the convertible securities had a dilutive effect in 2011, 2010, 2009 or 2008. All of the convertible preference shares had a dilutive effect in 2007 and as such were included in the computation
of diluted earnings per share.
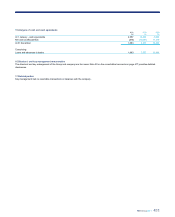
(3) Dividend payout ratio represents the interim dividend paid and final dividend proposed as a percentage of profit attributable to ordinary and B shareholders before discontinued operations, integration
and restructuring costs, amortisation of purchased intangible assets and net gain on sale of strategic investments and subsidiaries (net of tax).
(4) Return on average total assets represents (loss)/profit attributable to ordinary and B shareholders as a percentage of average total assets.
(5) Return on average ordinary and B shareholders' equity represents (loss)/profit attributable to ordinary and B shareholders expressed as a percentage of average ordinary and B shareholders' equity.
(6) Adjusted return on average ordinary and B shareholders' equity represents (loss)/profit attributable to ordinary and B shareholders before discontinued operations, movements in the fair value of own
debt, Asset Protection Scheme credit, Payment Protection Insurance costs, sovereign debt impairment, amortisation of purchased intangible assets, integration and restructuring costs, gain on
redemption of own debt, strategic disposals, bonus tax, bank levy, gains on pensions curtailment, interest rate hedge adjustments on impaired available-for-sale Greek government bonds and write-
down of goodwill and other intangible assets expressed as a percentage of average ordinary and B shareholders' equity.
(7) For this purpose, earnings consist of income before tax and non-controlling interests, plus fixed charges less the unremitted income of associated undertakings (share of profits less dividends
received). Fixed charges consist of total interest expense, including or excluding interest on deposits and debt securities in issue, as appropriate, and the proportion of rental expense deemed
representative of the interest factor (one third of total rental expenses).
Additional information continued