RBS 2011 Annual Report Download - page 355
Download and view the complete annual report
Please find page 355 of the 2011 RBS annual report below. You can navigate through the pages in the report by either clicking on the pages listed below, or by using the keyword search tool below to find specific information within the annual report.-
 1
1 -
2
-
3
-
4
-
5
-
6
-
7
-
8
-
9
-
10
-
11
-
12
-
13
-
14
-
15
-
16
-
17
-
18
-
19
-
20
-
21
-
22
-
23
-
24
-
25
-
26
-
27
-
28
-
29
-
30
-
31
-
32
-
33
-
34
-
35
-
36
-
37
-
38
-
39
-
40
-
41
-
42
-
43
-
44
-
45
-
46
-
47
-
48
-
49
-
50
-
51
-
52
-
53
-
54
-
55
-
56
-
57
-
58
-
59
-
60
-
61
-
62
-
63
-
64
-
65
-
66
-
67
-
68
-
69
-
70
-
71
-
72
-
73
-
74
-
75
-
76
-
77
-
78
-
79
-
80
-
81
-
82
-
83
-
84
-
85
-
86
-
87
-
88
-
89
-
90
-
91
-
92
-
93
-
94
-
95
-
96
-
97
-
98
-
99
-
100
-
101
-
102
-
103
-
104
-
105
-
106
-
107
-
108
-
109
-
110
-
111
-
112
-
113
-
114
-
115
-
116
-
117
-
118
-
119
-
120
-
121
-
122
-
123
-
124
-
125
-
126
-
127
-
128
-
129
-
130
-
131
-
132
-
133
-
134
-
135
-
136
-
137
-
138
-
139
-
140
-
141
-
142
-
143
-
144
-
145
-
146
-
147
-
148
-
149
-
150
-
151
-
152
-
153
-
154
-
155
-
156
-
157
-
158
-
159
-
160
-
161
-
162
-
163
-
164
-
165
-
166
-
167
-
168
-
169
-
170
-
171
-
172
-
173
-
174
-
175
-
176
-
177
-
178
-
179
-
180
-
181
-
182
-
183
-
184
-
185
-
186
-
187
-
188
-
189
-
190
-
191
-
192
-
193
-
194
-
195
-
196
-
197
-
198
-
199
-
200
-
201
-
202
-
203
-
204
-
205
-
206
-
207
-
208
-
209
-
210
-
211
-
212
-
213
-
214
-
215
-
216
-
217
-
218
-
219
-
220
-
221
-
222
-
223
-
224
-
225
-
226
-
227
-
228
-
229
-
230
-
231
-
232
-
233
-
234
-
235
-
236
-
237
-
238
-
239
-
240
-
241
-
242
-
243
-
244
-
245
-
246
-
247
-
248
-
249
-
250
-
251
-
252
-
253
-
254
-
255
-
256
-
257
-
258
-
259
-
260
-
261
-
262
-
263
-
264
-
265
-
266
-
267
-
268
-
269
-
270
-
271
-
272
-
273
-
274
-
275
-
276
-
277
-
278
-
279
-
280
-
281
-
282
-
283
-
284
-
285
-
286
-
287
-
288
-
289
-
290
-
291
-
292
-
293
-
294
-
295
-
296
-
297
-
298
-
299
-
300
-
301
-
302
-
303
-
304
-
305
-
306
-
307
-
308
-
309
-
310
-
311
-
312
-
313
-
314
-
315
-
316
-
317
-
318
-
319
-
320
-
321
-
322
-
323
-
324
-
325
-
326
-
327
-
328
-
329
-
330
-
331
-
332
-
333
-
334
-
335
-
336
-
337
-
338
-
339
-
340
-
341
-
342
-
343
-
344
-
 345
345 -
 346
346 -
 347
347 -
 348
348 -
 349
349 -
 350
350 -
 351
351 -
 352
352 -
 353
353 -
 354
354 -
 355
355 -
 356
356 -
 357
357 -
 358
358 -
 359
359 -
 360
360 -
 361
361 -
 362
362 -
 363
363 -
 364
364 -
 365
365 -
366
-
367
-
368
-
369
-
370
-
371
-
372
-
373
-
374
-
375
-
376
-
377
-
378
-
379
-
380
-
381
-
382
-
383
-
384
-
385
-
386
-
387
-
388
-
389
-
390
-
391
-
392
-
393
-
394
-
395
-
396
-
397
-
398
-
399
-
400
-
401
-
402
-
403
-
404
-
405
-
406
-
407
-
408
-
409
-
410
-
411
-
412
-
413
-
414
-
415
-
416
-
417
-
418
-
419
-
420
-
421
-
422
-
423
-
424
-
425
-
426
-
427
-
428
-
429
-
430
-
431
-
432
-
433
-
434
-
435
-
436
-
437
-
438
-
439
-
440
-
441
-
442
-
443
-
444
-
445
-
446
-
447
-
448
-
449
-
450
-
451
-
452
-
453
-
454
-
455
-
456
-
457
-
458
-
459
-
460
-
461
-
462
-
463
-
464
-
465
-
466
-
467
-
468
-
469
-
470
-
471
-
472
-
473
-
474
-
475
-
476
-
477
-
478
-
479
-
480
-
481
-
482
-
483
-
484
-
485
-
486
-
487
-
488
-
489
-
490
 |
 |

RBS Group 2011 353
Key points
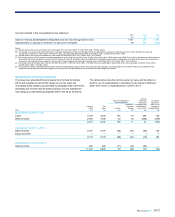
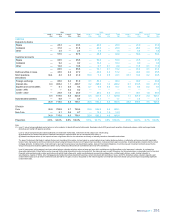
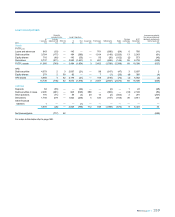
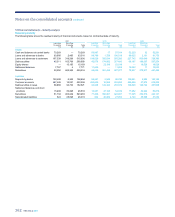
xTotal assets carried at fair value increased by £96.1 billion in the
year to £882.2 billion at 31 December 2011, principally reflecting
increases in derivative assets (£102.5 billion), reverse repos (£9.0
billion) and derivative collateral (£2.2 billion), partially offset by
decreases in debt securities (£7.4 billion) and equity shares (£7.0
billion).
xTotal liabilities carried at fair value increased by £115.7 billion, with
increases in derivative liabilities (£100.0 billion), repos (£15.2 billion)
and collateral (£4.0 billion), partially offset by decreases in debt
securities in issue (£4.0 billion) and short positions (£2.1 billion).
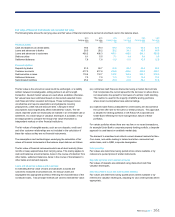
xLevel 3 assets of £16.4 billion represented 1.9% (2010 - £15.7 billion
and 2.0%) of assets at fair value, an increase of £0.7 billion. This
reflected transfers from level 2 to level 3 of £5.7 billion based on a
review in the latter part of 2011 in light of liquidity in the market,
maturity and sale of instruments. These transfers related to ABS in
Non-Core Markets and certain foreign exchange options and credit
derivatives in GBM. £1.9 billion was transferred from level 3 to level
2, based on the re-assessment of the impact and nature of
unobservable inputs used in valuation models.
xLevel 3 liabilities increased to £6.3 billion in the year from £4.8 billion,
mainly in credit derivatives due to market liquidity and resultant
transfers from level 2 to level 3.
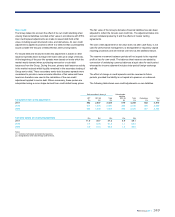
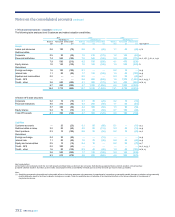
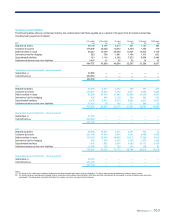
xThe favourable and unfavourable effects of reasonably possible
alternative assumptions on level 3 instruments carried at fair value
excluding APS credit derivatives were £2.0 billion favourable (2010 -
£1.7 billion favourable) and £1.4 billion unfavourable (2010 - £1.2
billion unfavourable) respectively. Favourable and unfavourable
sensitivities for APS credit derivatives were £0.3 billion (2010 - £0.9
billion favourable) and £0.1 billion unfavourable (2010 - £0.9 billion
unfavourable). The change in APS sensitivities reflected the
decrease in overall value of the Scheme.
xThere were no significant transfers between level 1 and level 2.
The level 3 sensitivities above are calculated at a trade or low level
portfolio basis. They are not calculated on an overall portfolio basis and
therefore do not reflect the likely overall potential uncertainty on the
whole portfolio. The figures are aggregated and do not reflect the
correlated nature of some of the sensitivities. In particular, for some of the
portfolios the sensitivities may be negatively correlated where a
downwards movement in one asset would produce an upwards
movement in another, but due to the additive presentation of the above
figures this correlation cannot be observed. For example, with assets in
the APS, the downwards sensitivity on the underlying asset would be
partially offset by the consequent upward movement of the APS
derivative, so whilst the net sensitivity of the two positions may be lower,
it would be shown with the gross upside and downside sensitivity of the
two assets inflating the overall sensitivity figures in the above table. The
actual potential downside sensitivity of the total portfolio may be less than
the non-correlated sum of the additive figures as shown in the above
table.
Judgmental issues
The diverse range of products traded by the Group results in a wide
range of instruments that are classified into the three level hierarchy.
Whilst the majority of these instruments naturally fall into a particular
level, for some products an element of judgment is required. The majority
of the Group’s financial instruments carried at fair value are classified as
level 2: inputs are observable either directly (i.e. as a price) or indirectly
(i.e. derived from prices).
Active and inactive markets
Akey input in the decision making process for the allocation of assets to
aparticular level is liquidity. In general, the degree of valuation
uncertainty depends on the degree of liquidity of an input. For example, a
derivative can be placed into level 2 or level 3 dependent upon its
liquidity.
Where markets are liquid or very liquid, little judgment is required.
However, when the information regarding the liquidity in a particular
market is not clear, a judgment may need to be made. This can be made
more difficult as assessing the liquidity of a market may not always be
straightforward. For an equity traded on an exchange, daily volumes of
trading can be seen, but for an-over-the counter (OTC) derivative
assessing the liquidity of the market with no central exchange can be
more difficult.
Akey related issue is where a market moves from liquid to illiquid or vice
versa. Where this change is considered to be temporary, the
classification is not changed. For example, if there is little market trading
in a product on a reporting date but at the previous reporting date and
during the intervening period the market has been considered to be
liquid, the instrument will continue to be classified in the same level in the
hierarchy. This is to provide consistency so that transfers between levels
are driven by genuine changes in market liquidity and do not reflect short
term or seasonal effects.
Interaction with the IPV process
The determination of an instrument’s level cannot be made at a global
product level as a single product type can be in more than one level. For
example, a single name corporate credit default swap could be in level 2
or level 3 depending on whether the reference counterparty is liquid or
illiquid.
As part of the Group’s IPV process, data is gathered at a trade level from
market trading activity, trading systems, pricing services, consensus
pricing providers, brokers and research material amongst other sources.
The breadth and detail of this data allows a good assessment to be made
of liquidity and pricing uncertainty, which assists with the process of
allocation to an appropriate level. Where suitable independent pricing
information is not readily available the instrument will be considered to be
level 3.