RBS 2011 Annual Report Download - page 46
Download and view the complete annual report
Please find page 46 of the 2011 RBS annual report below. You can navigate through the pages in the report by either clicking on the pages listed below, or by using the keyword search tool below to find specific information within the annual report.-
 1
1 -
2
-
3
-
4
-
5
-
6
-
7
-
8
-
9
-
10
-
11
-
12
-
13
-
14
-
15
-
16
-
17
-
18
-
19
-
20
-
21
-
22
-
23
-
24
-
25
-
26
-
27
-
28
-
29
-
30
-
31
-
32
-
33
-
34
-
35
-
 36
36 -
 37
37 -
 38
38 -
 39
39 -
 40
40 -
 41
41 -
 42
42 -
 43
43 -
 44
44 -
 45
45 -
 46
46 -
 47
47 -
 48
48 -
 49
49 -
 50
50 -
 51
51 -
 52
52 -
 53
53 -
 54
54 -
 55
55 -
 56
56 -
57
-
58
-
59
-
60
-
61
-
62
-
63
-
64
-
65
-
66
-
67
-
68
-
69
-
70
-
71
-
72
-
73
-
74
-
75
-
76
-
77
-
78
-
79
-
80
-
81
-
82
-
83
-
84
-
85
-
86
-
87
-
88
-
89
-
90
-
91
-
92
-
93
-
94
-
95
-
96
-
97
-
98
-
99
-
100
-
101
-
102
-
103
-
104
-
105
-
106
-
107
-
108
-
109
-
110
-
111
-
112
-
113
-
114
-
115
-
116
-
117
-
118
-
119
-
120
-
121
-
122
-
123
-
124
-
125
-
126
-
127
-
128
-
129
-
130
-
131
-
132
-
133
-
134
-
135
-
136
-
137
-
138
-
139
-
140
-
141
-
142
-
143
-
144
-
145
-
146
-
147
-
148
-
149
-
150
-
151
-
152
-
153
-
154
-
155
-
156
-
157
-
158
-
159
-
160
-
161
-
162
-
163
-
164
-
165
-
166
-
167
-
168
-
169
-
170
-
171
-
172
-
173
-
174
-
175
-
176
-
177
-
178
-
179
-
180
-
181
-
182
-
183
-
184
-
185
-
186
-
187
-
188
-
189
-
190
-
191
-
192
-
193
-
194
-
195
-
196
-
197
-
198
-
199
-
200
-
201
-
202
-
203
-
204
-
205
-
206
-
207
-
208
-
209
-
210
-
211
-
212
-
213
-
214
-
215
-
216
-
217
-
218
-
219
-
220
-
221
-
222
-
223
-
224
-
225
-
226
-
227
-
228
-
229
-
230
-
231
-
232
-
233
-
234
-
235
-
236
-
237
-
238
-
239
-
240
-
241
-
242
-
243
-
244
-
245
-
246
-
247
-
248
-
249
-
250
-
251
-
252
-
253
-
254
-
255
-
256
-
257
-
258
-
259
-
260
-
261
-
262
-
263
-
264
-
265
-
266
-
267
-
268
-
269
-
270
-
271
-
272
-
273
-
274
-
275
-
276
-
277
-
278
-
279
-
280
-
281
-
282
-
283
-
284
-
285
-
286
-
287
-
288
-
289
-
290
-
291
-
292
-
293
-
294
-
295
-
296
-
297
-
298
-
299
-
300
-
301
-
302
-
303
-
304
-
305
-
306
-
307
-
308
-
309
-
310
-
311
-
312
-
313
-
314
-
315
-
316
-
317
-
318
-
319
-
320
-
321
-
322
-
323
-
324
-
325
-
326
-
327
-
328
-
329
-
330
-
331
-
332
-
333
-
334
-
335
-
336
-
337
-
338
-
339
-
340
-
341
-
342
-
343
-
344
-
345
-
346
-
347
-
348
-
349
-
350
-
351
-
352
-
353
-
354
-
355
-
356
-
357
-
358
-
359
-
360
-
361
-
362
-
363
-
364
-
365
-
366
-
367
-
368
-
369
-
370
-
371
-
372
-
373
-
374
-
375
-
376
-
377
-
378
-
379
-
380
-
381
-
382
-
383
-
384
-
385
-
386
-
387
-
388
-
389
-
390
-
391
-
392
-
393
-
394
-
395
-
396
-
397
-
398
-
399
-
400
-
401
-
402
-
403
-
404
-
405
-
406
-
407
-
408
-
409
-
410
-
411
-
412
-
413
-
414
-
415
-
416
-
417
-
418
-
419
-
420
-
421
-
422
-
423
-
424
-
425
-
426
-
427
-
428
-
429
-
430
-
431
-
432
-
433
-
434
-
435
-
436
-
437
-
438
-
439
-
440
-
441
-
442
-
443
-
444
-
445
-
446
-
447
-
448
-
449
-
450
-
451
-
452
-
453
-
454
-
455
-
456
-
457
-
458
-
459
-
460
-
461
-
462
-
463
-
464
-
465
-
466
-
467
-
468
-
469
-
470
-
471
-
472
-
473
-
474
-
475
-
476
-
477
-
478
-
479
-
480
-
481
-
482
-
483
-
484
-
485
-
486
-
487
-
488
-
489
-
490
 |
 |

44 RBS Group 2011
Results summary continued
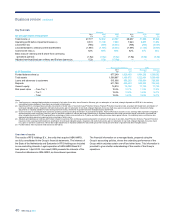
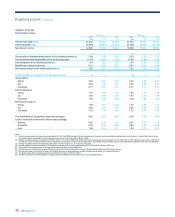
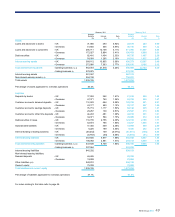
2010 compared with 2009 - managed
Operating profit/(loss)
Group operating profit, excluding fair value of own debt, amortisation of
purchased intangible assets, integration and restructuring costs, gain on
redemption of own debt, strategic disposals, bonus tax, gains on
pensions curtailment, fair value changes in the Asset Protection Scheme,
write-down of goodwill and other intangible assets and RFS MI, was
£1,913 million, compared with a loss of £6,090 million in 2009. The
improvement in performance is primarily driven by stronger Core Retail &
Commercial operating profits offsetting more normal results from Global
Banking & Markets, coupled with lower impairments in the Non-Core
division.
After fair value of own debt, amortisation of purchased intangible assets,
integration and restructuring costs, gain on redemption of own debt,
strategic disposals, bonus tax, gains on pensions curtailment, write-down
of goodwill and other intangible assets and RFS MI, the Group recorded
aloss before tax of £399 million, compared with a loss before tax of
£2,647 million in 2009.
After tax, non-controlling interests and preference share and other
dividends, the loss attributable to ordinary and B shareholders was
£1,125 million, compared with an attributable loss of £3,607 million in
2009.
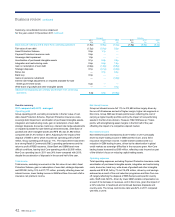
Total income
Total income, excluding fair value of own debt, gain on redemption of
own debt, strategic disposals, fair value changes in the Asset Protection
Scheme and RFS MI, increased by 10% to £32,662 million, primarily
reflecting growth in net interest income coupled with lower Non-Core
trading losses as underlying asset prices recovered and credit spreads
tightened. Whilst income was down in Global Banking & Markets to more
normal levels compared with the favourable market conditions seen in
2009, this was offset by good growth in Core Retail & Commercial and
the improvement in Non-Core.
Net interest income
Net interest income increased by 5% to £14,200 million reflecting
improvements in net interest margin which more than offset lower
interest-earning assets and interest-bearing liabilities. Group net interest
margin increased from 1.76% to 2.01% largely reflecting expanding asset
margins in UK Retail and UK Corporate divisions as well as in US Retail
&Commercial. The run-off of low-yielding Non-Core assets also
contributed to this increase. The Group net interest margin was also
affected by increased funding costs.
Non-interest income
Non-interest income increased to £18,462 million from £16,000 million in
2009, largely reflecting the sharp improvement in Non-Core from reduced
trading losses. This was partially offset by lower trading revenues in
Global Banking & Markets, which had seen unusually buoyant market
conditions in 2009 as rapidly falling interest rates generated significant
revenue opportunities.
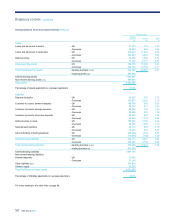
Operating expenses
Total operating expenses, excluding amortisation of purchased intangible
assets, integration and restructuring costs, bonus tax, gains on pensions
curtailment, write-down of goodwill and other intangible assets and RFS
MI, fell by 4% to £16,710 million, largely reflecting the recognition of
benefits from the Group-wide efficiency programme. The programme
continues to deliver material savings which have been funding
investments to strengthen our Core franchises. Premises and equipment
costs fell by 8% in the year largely driven by efficiency cost savings,
significant one-off property impairments recognised in 2009 and country
exits following Non-Core disposals. The Group cost:income ratio
improved by 9 percentage points in 2010 to 60%.
Impairment losses
Impairment losses fell to £9,256 million from £13,899 million in 2009, with
Core impairments falling by £898 million and Non-Core by £3,745 million.
The decrease reflects an overall improvement in the economic
environment. Impairments fell in all businesses, except Ulster Bank,
which has faced an economic environment that remains challenging.
Impairments represented 1.7% of gross loans and advances, excluding
reverse repos, in 2010 compared with 2.3% in 2009.
Risk elements in lending and potential problem loans at 31 December
2010 represented 7.4% of loans and advances, excluding reverse repos,
compared with 6.2% a year earlier. Provision coverage was 46%,
compared with 43% at 31 December 2009.
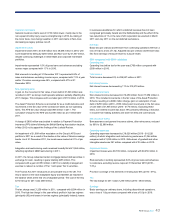
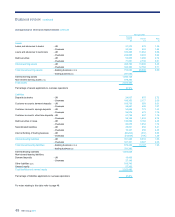
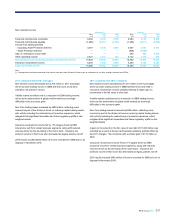
One-off and other items
Integration andrestructuring costs decreased from £1,286 million to
£1,032 million, primarily as ABN AMRO integration activity neared
completion, partly offset by restructuring activity following the conclusion
of the strategic review.
In 2010 the Group recorded a gain of £553 million, compared with £3,790
million in 2009, on a liability management exercise to redeem a number
of Tier 1 and upper Tier 2 securities. In addition, the overall gain on
strategic disposals, £171 million, primarily relates to gains on the sale of
GMS partially offset by provisions for losses on the sales of other
businesses undertaken as part of the Group’s Strategic Plan.
The Asset Protection Scheme is accounted for as a credit derivative, and
movements in the fair value of the contract are taken as non-operating
items. The charge of £1,550 million in 2010 reflects improving credit
spreads on the portfolio of covered assets, as well as a decrease in
covered assets.
Tax
The Group recorded a tax charge of £634 million in 2010, compared with
atax credit of £429 million in 2009.
Earnings
Basic loss per ordinary and B share from continuing operations improved
from a loss of 6.3p to a loss of 0.5p. Adjusted loss per ordinary and B
share improved from a loss of 13.0p to earnings of 0.5p per share.
Business review continued