RBS 2011 Annual Report Download - page 45
Download and view the complete annual report
Please find page 45 of the 2011 RBS annual report below. You can navigate through the pages in the report by either clicking on the pages listed below, or by using the keyword search tool below to find specific information within the annual report.-
 1
1 -
2
-
3
-
4
-
5
-
6
-
7
-
8
-
9
-
10
-
11
-
12
-
13
-
14
-
15
-
16
-
17
-
18
-
19
-
20
-
21
-
22
-
23
-
24
-
25
-
26
-
27
-
28
-
29
-
30
-
31
-
32
-
33
-
34
-
 35
35 -
 36
36 -
 37
37 -
 38
38 -
 39
39 -
 40
40 -
 41
41 -
 42
42 -
 43
43 -
 44
44 -
 45
45 -
 46
46 -
 47
47 -
 48
48 -
 49
49 -
 50
50 -
 51
51 -
 52
52 -
 53
53 -
 54
54 -
 55
55 -
56
-
57
-
58
-
59
-
60
-
61
-
62
-
63
-
64
-
65
-
66
-
67
-
68
-
69
-
70
-
71
-
72
-
73
-
74
-
75
-
76
-
77
-
78
-
79
-
80
-
81
-
82
-
83
-
84
-
85
-
86
-
87
-
88
-
89
-
90
-
91
-
92
-
93
-
94
-
95
-
96
-
97
-
98
-
99
-
100
-
101
-
102
-
103
-
104
-
105
-
106
-
107
-
108
-
109
-
110
-
111
-
112
-
113
-
114
-
115
-
116
-
117
-
118
-
119
-
120
-
121
-
122
-
123
-
124
-
125
-
126
-
127
-
128
-
129
-
130
-
131
-
132
-
133
-
134
-
135
-
136
-
137
-
138
-
139
-
140
-
141
-
142
-
143
-
144
-
145
-
146
-
147
-
148
-
149
-
150
-
151
-
152
-
153
-
154
-
155
-
156
-
157
-
158
-
159
-
160
-
161
-
162
-
163
-
164
-
165
-
166
-
167
-
168
-
169
-
170
-
171
-
172
-
173
-
174
-
175
-
176
-
177
-
178
-
179
-
180
-
181
-
182
-
183
-
184
-
185
-
186
-
187
-
188
-
189
-
190
-
191
-
192
-
193
-
194
-
195
-
196
-
197
-
198
-
199
-
200
-
201
-
202
-
203
-
204
-
205
-
206
-
207
-
208
-
209
-
210
-
211
-
212
-
213
-
214
-
215
-
216
-
217
-
218
-
219
-
220
-
221
-
222
-
223
-
224
-
225
-
226
-
227
-
228
-
229
-
230
-
231
-
232
-
233
-
234
-
235
-
236
-
237
-
238
-
239
-
240
-
241
-
242
-
243
-
244
-
245
-
246
-
247
-
248
-
249
-
250
-
251
-
252
-
253
-
254
-
255
-
256
-
257
-
258
-
259
-
260
-
261
-
262
-
263
-
264
-
265
-
266
-
267
-
268
-
269
-
270
-
271
-
272
-
273
-
274
-
275
-
276
-
277
-
278
-
279
-
280
-
281
-
282
-
283
-
284
-
285
-
286
-
287
-
288
-
289
-
290
-
291
-
292
-
293
-
294
-
295
-
296
-
297
-
298
-
299
-
300
-
301
-
302
-
303
-
304
-
305
-
306
-
307
-
308
-
309
-
310
-
311
-
312
-
313
-
314
-
315
-
316
-
317
-
318
-
319
-
320
-
321
-
322
-
323
-
324
-
325
-
326
-
327
-
328
-
329
-
330
-
331
-
332
-
333
-
334
-
335
-
336
-
337
-
338
-
339
-
340
-
341
-
342
-
343
-
344
-
345
-
346
-
347
-
348
-
349
-
350
-
351
-
352
-
353
-
354
-
355
-
356
-
357
-
358
-
359
-
360
-
361
-
362
-
363
-
364
-
365
-
366
-
367
-
368
-
369
-
370
-
371
-
372
-
373
-
374
-
375
-
376
-
377
-
378
-
379
-
380
-
381
-
382
-
383
-
384
-
385
-
386
-
387
-
388
-
389
-
390
-
391
-
392
-
393
-
394
-
395
-
396
-
397
-
398
-
399
-
400
-
401
-
402
-
403
-
404
-
405
-
406
-
407
-
408
-
409
-
410
-
411
-
412
-
413
-
414
-
415
-
416
-
417
-
418
-
419
-
420
-
421
-
422
-
423
-
424
-
425
-
426
-
427
-
428
-
429
-
430
-
431
-
432
-
433
-
434
-
435
-
436
-
437
-
438
-
439
-
440
-
441
-
442
-
443
-
444
-
445
-
446
-
447
-
448
-
449
-
450
-
451
-
452
-
453
-
454
-
455
-
456
-
457
-
458
-
459
-
460
-
461
-
462
-
463
-
464
-
465
-
466
-
467
-
468
-
469
-
470
-
471
-
472
-
473
-
474
-
475
-
476
-
477
-
478
-
479
-
480
-
481
-
482
-
483
-
484
-
485
-
486
-
487
-
488
-
489
-
490
 |
 |

RBS Group 2011 43
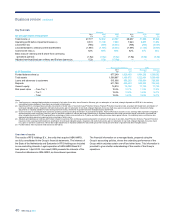
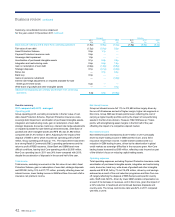
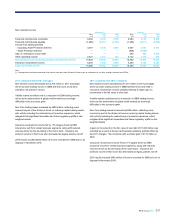
Insurance net claims
General insurance claims were £1,730 million lower, mainly due to the
non-repeat of bodily injury reserve strengthening in 2010, de-risking of
the motor book, more benign weather in 2011 and claims in Non-Core
decreasing as legacy policies ran-off.
Impairment losses
Impairment losses fell to £7,439 million from £9,256 million in 2010, with
Core impairments falling by £260 million and Non-Core by £1,557 million,
despite continuing challenges in Ulster Bank and corporate real estate
portfolios.
Impairments represented 1.5% of gross loans and advances excluding
reverse repos compared with 1.7% in 2010.
Risk elements in lending at 31 December 2011 represented 8.6% of
loans and advances excluding reverse repos, compared with 7.3% a year
earlier. Provision coverage was 49%, compared with 47% at 31
December 2010.
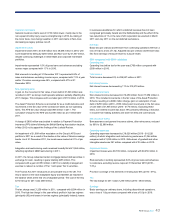
Non-operating items
Again on the movement in fair value of own debt of £1,846 million was
recorded in 2011 as Group credit spreads widened, partially offsetting the
2011 charges. This compares with a smaller gain of £174 million in 2010.
The Asset Protection Scheme is accounted for as a credit derivative and
movements in the fair value of the contract are taken as non-operating
items. The APS fair value charge was £906 million in 2011. The
cumulative charge for the APS was £2,456 million as at 31 December
2011.
Acharge of £850 million was booked in relation to Payment Protection
Insurance (PPI) claims following the British Banking Association decision,
in May 2012 not to appeal the findings of the Judicial Review.
An impairment of £1,099 million was taken on the Group’s AFS bond
portfolio in 2011 as a result of the decline in the value of Greek sovereign
bonds. As of 31 December 2011, the bonds were marked at 21% of par
value.
Integration and restructuring costs remained broadly flat at £1,064 million,
reflecting significant GBM restructuring in 2011.
In 2011, the Group redeemed certain mortgage backed debt securities in
exchange for cash, resulting in gains totalling £255 million. This
compared with a gain of £553 million in 2010 on a liability management
exercise to redeem a number of Tier 1 and upper Tier 2 securities.
The Finance Act 2011 introduced an annual bank levy in the UK. The
levy is based on the total chargeable equity and liabilities as reported in
the balance sheet at the end of a chargeable period. The cost of the levy
to the Group for 2011 was £300 million.
Tax
The taxcharge was £1,250 million in 2011, compared with £634 million in
2010. The high tax charge in the year reflects profits in high tax regimes
(principally US) and losses in low tax regimes (principally Ireland), losses
in overseas subsidiaries for which a deferred tax asset has not been
recognised (principally Ireland and the Netherlands) and the effect of the
two reductions of 1% in the rate of UK corporation tax enacted in March
2011 and July 2011 on the net deferred tax balance.
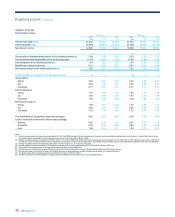
Earnings
Basic loss per ordinary and B share from continuing operations fell from a
loss of 0.5p to a loss of 1.8p. Adjusted loss per ordinary and B share also
fell, from earnings of 0.5p per share to 0.2p per share.
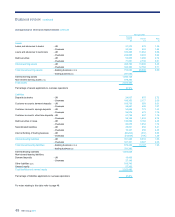
2011 compared with 2010 - statutory
Operating loss
Operating loss before tax for the year was £766 million compared with
£399 million in 2010.
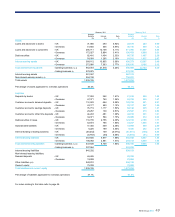
Total income
Total income decreased 9% to £28,937 million in 2011.
Net interest income
Net interest income decreased by 11% to £12,679 million.
Non-interest income
Non-interest income decreased to £16,258 million from £17,659 million in
2010. This included movements in the fair value of the Asset Protection
Scheme resulting in a £906 million charge, gain on redemption of own
debt of £255 million (2010 - £553 million) and movements in the fair value
of own debt of £1,846 million (2010 - £174 million). Excluding these
items, non-interest income was down 19% primarily reflecting a reduction
in income from trading activities and lower net fees and commissions.
Net insurance claims
Bancassurance and general insurance claims, after reinsurance, reduced
by 38% to £2,968 million.
Operating expenses
Operating expenses decreased to £18,026 million (2010 - £18,228
million) of which integration and restructuring costs were £1,064 million
compared with £1,032 million in 2010. Write-down of goodwill and other
intangible assets was £91 million compared with £10 million in 2010.
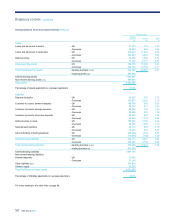
Impairment losses
Impairment losses were £8,709 million, compared with £9,256 million in
2010.
Risk elements in lending represented 8.6% of gross loans and advances
to customers excluding reverse repos at 31 December 2010 (2010 -
7.3%).
Provision coverage of risk elements in lending was 49% (2010 - 47%).
Tax
The taxcharge for 2011 was £1,250 million (2010 - £634 million).
Earnings
Basic earnings per ordinary share, including discontinued operations,
was a loss of 1.8p per share compared with a loss of 0.5p in 2010.