RBS 2011 Annual Report Download - page 69
Download and view the complete annual report
Please find page 69 of the 2011 RBS annual report below. You can navigate through the pages in the report by either clicking on the pages listed below, or by using the keyword search tool below to find specific information within the annual report.-
 1
1 -
2
-
3
-
4
-
5
-
6
-
7
-
8
-
9
-
10
-
11
-
12
-
13
-
14
-
15
-
16
-
17
-
18
-
19
-
20
-
21
-
22
-
23
-
24
-
25
-
26
-
27
-
28
-
29
-
30
-
31
-
32
-
33
-
34
-
35
-
36
-
37
-
38
-
39
-
40
-
41
-
42
-
43
-
44
-
45
-
46
-
47
-
48
-
49
-
50
-
51
-
52
-
53
-
54
-
55
-
56
-
57
-
58
-
 59
59 -
 60
60 -
 61
61 -
 62
62 -
 63
63 -
 64
64 -
 65
65 -
 66
66 -
 67
67 -
 68
68 -
 69
69 -
 70
70 -
 71
71 -
 72
72 -
 73
73 -
 74
74 -
 75
75 -
 76
76 -
 77
77 -
 78
78 -
 79
79 -
80
-
81
-
82
-
83
-
84
-
85
-
86
-
87
-
88
-
89
-
90
-
91
-
92
-
93
-
94
-
95
-
96
-
97
-
98
-
99
-
100
-
101
-
102
-
103
-
104
-
105
-
106
-
107
-
108
-
109
-
110
-
111
-
112
-
113
-
114
-
115
-
116
-
117
-
118
-
119
-
120
-
121
-
122
-
123
-
124
-
125
-
126
-
127
-
128
-
129
-
130
-
131
-
132
-
133
-
134
-
135
-
136
-
137
-
138
-
139
-
140
-
141
-
142
-
143
-
144
-
145
-
146
-
147
-
148
-
149
-
150
-
151
-
152
-
153
-
154
-
155
-
156
-
157
-
158
-
159
-
160
-
161
-
162
-
163
-
164
-
165
-
166
-
167
-
168
-
169
-
170
-
171
-
172
-
173
-
174
-
175
-
176
-
177
-
178
-
179
-
180
-
181
-
182
-
183
-
184
-
185
-
186
-
187
-
188
-
189
-
190
-
191
-
192
-
193
-
194
-
195
-
196
-
197
-
198
-
199
-
200
-
201
-
202
-
203
-
204
-
205
-
206
-
207
-
208
-
209
-
210
-
211
-
212
-
213
-
214
-
215
-
216
-
217
-
218
-
219
-
220
-
221
-
222
-
223
-
224
-
225
-
226
-
227
-
228
-
229
-
230
-
231
-
232
-
233
-
234
-
235
-
236
-
237
-
238
-
239
-
240
-
241
-
242
-
243
-
244
-
245
-
246
-
247
-
248
-
249
-
250
-
251
-
252
-
253
-
254
-
255
-
256
-
257
-
258
-
259
-
260
-
261
-
262
-
263
-
264
-
265
-
266
-
267
-
268
-
269
-
270
-
271
-
272
-
273
-
274
-
275
-
276
-
277
-
278
-
279
-
280
-
281
-
282
-
283
-
284
-
285
-
286
-
287
-
288
-
289
-
290
-
291
-
292
-
293
-
294
-
295
-
296
-
297
-
298
-
299
-
300
-
301
-
302
-
303
-
304
-
305
-
306
-
307
-
308
-
309
-
310
-
311
-
312
-
313
-
314
-
315
-
316
-
317
-
318
-
319
-
320
-
321
-
322
-
323
-
324
-
325
-
326
-
327
-
328
-
329
-
330
-
331
-
332
-
333
-
334
-
335
-
336
-
337
-
338
-
339
-
340
-
341
-
342
-
343
-
344
-
345
-
346
-
347
-
348
-
349
-
350
-
351
-
352
-
353
-
354
-
355
-
356
-
357
-
358
-
359
-
360
-
361
-
362
-
363
-
364
-
365
-
366
-
367
-
368
-
369
-
370
-
371
-
372
-
373
-
374
-
375
-
376
-
377
-
378
-
379
-
380
-
381
-
382
-
383
-
384
-
385
-
386
-
387
-
388
-
389
-
390
-
391
-
392
-
393
-
394
-
395
-
396
-
397
-
398
-
399
-
400
-
401
-
402
-
403
-
404
-
405
-
406
-
407
-
408
-
409
-
410
-
411
-
412
-
413
-
414
-
415
-
416
-
417
-
418
-
419
-
420
-
421
-
422
-
423
-
424
-
425
-
426
-
427
-
428
-
429
-
430
-
431
-
432
-
433
-
434
-
435
-
436
-
437
-
438
-
439
-
440
-
441
-
442
-
443
-
444
-
445
-
446
-
447
-
448
-
449
-
450
-
451
-
452
-
453
-
454
-
455
-
456
-
457
-
458
-
459
-
460
-
461
-
462
-
463
-
464
-
465
-
466
-
467
-
468
-
469
-
470
-
471
-
472
-
473
-
474
-
475
-
476
-
477
-
478
-
479
-
480
-
481
-
482
-
483
-
484
-
485
-
486
-
487
-
488
-
489
-
490
 |
 |

RBS Group 2011 67
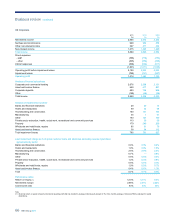
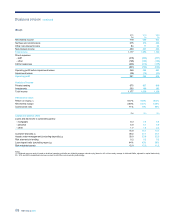
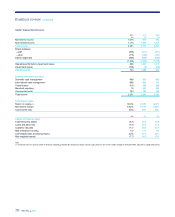
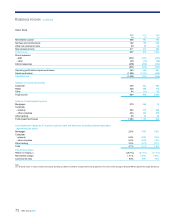
2011 2010 2009
£bn £bn £bn
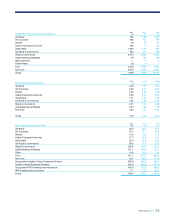
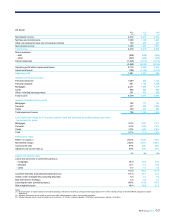
Capital and balance sheet
Total third party assets 111.8 114.6 114.9
Loans and advances to customers (gross) (1)
-banks and financial institutions 5.7 6.1 6.3
- hotels and restaurants 6.1 6.8 6.7
- housebuilding and construction 3.9 4.5 4.3
- manufacturing 4.6 5.3 5.9
- other 32.6 31.0 29.9
- private sector education, health, social work, recreational and community services 8.7 9.0 6.5
- property 28.2 29.5 33.0
- wholesale and retail trade, repairs 8.5 9.6 10.2
- asset and invoice finance 10.4 9.9 8.8
108.7 111.7 111.6
Customer deposits (1) 100.9 100.0 87.8
Risk elements in lending (1) 5.0 4.0 2.3
Loan:deposit ratio (excluding repos) 106% 110% 126%
Risk-weighted assets 76.1 81.4 90.2
Note:
(1) Includes disposal groups: loans and advances to customers - £12.2 billion; customer deposits - £21.8 billion; risk elements in lending - £1.0 billion.
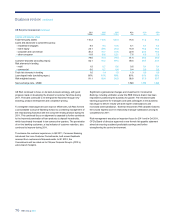
In 2011, UK Corporate focused on supporting its customers through
challenging economic times. As a result of over 5,000 hours of customer
research, UK Corporate launched the ‘Ahead for Business’ promise to its
small and medium-sized enterprise (SME) customers.
To deliver on this, the division launched a number of initiatives to improve
the service it offers to customers. For example, the ‘Working with You’
initiative, has seen over 4,600 visits to customer businesses since its
launch in Q2 2011. Additionally, following the launch of the relationship
manager accreditation programme, also in Q2 2011, almost all
relationship managers have gained full accreditation in the initial phase.
UK Corporate continued to support new and existing businesses during
2011:
xlaunching its best ever fixed rate loan product for SMEs;
xreacting quickly after the August riots to give affected businesses
access to special interest rate and fee free lending products;
xanswering over 4,000 calls on the Start-up Hotline, offering free
advice and a complementary business plan review service; and
xsupporting more debt capital and loan market deals for larger
corporates than any other bank.
The division also took measures to reduce the risk retained in the
business allowing for quicker and more consistent decisions by
simplifying the credit underwriting process and improving automated
decision making.
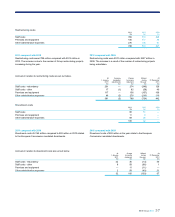
2011 compared with 2010
Operating profit decreased 3% to £1,414 million, as lower income and
higher impairments were only partially offset by a decrease in expenses.
Net interest income remained broadly flat. Net interest margin improved
7basis points with benefits from re-pricing the lending portfolio and the
revision to income deferral assumptions in Q1 2011 partially offset by
increased funding costs together with continued pressure on deposit
margins. A 1% increase in deposit balances supported an improvement
in the loan:deposit ratio to 106%.
Non-interest income decreased by 4% as a result of lower GBM cross-
sales and fee income, partially offset by increased Invoice Finance and
Lombard income.
Excluding the £29 million OFT penalty in 2010, total costs increased by
1%, largely reflecting increased investment in the business and higher
costs of managing the non-performing book.
Impairments of £785 million were 3% higher due to increased specific
impairments and collectively assessed provisions, partially offset by lower
latent loss provisions.
2010 compared with 2009
Operating profit grew by £338 million, 30%, compared with 2009, driven
by strong income growth and significantly lower impairments, partially
offset by higher costs.
UK Corporate performed strongly in the deposit market, with customer
deposit balance growth of £12 billion contributing to a 16 percentage
point improvement in the loan:deposit ratio in 2010. While customer
lending increased only marginally (with gross lending largely offset by
customer deleveraging) net interest income rose by £280 million, 12%,
and net interest margin rose by 29 basis points driven primarily by the
good progress made on loan repricing.
Non-interest income increased 3% reflecting strong refinancing levels
and increased operating lease activity, partially offset by lower sales of
financial market products.
Total costs increased 9% (£141 million) or 5% excluding the OFT penalty
in 2010, legal recovery in 2009 and the normalisation of staff
compensation phasing.
Impairments were 18% lower, primarily as a result of higher charges
taken during the first half of 2009 to reflect potential losses in the portfolio
not yet specifically identified.
Return on equity increased from 9.4% to 12.1%, reflecting higher
operating profit and lower RWAs as a result of improved risk metrics.