Bank of America 2001 Annual Report Download - page 107
Download and view the complete annual report
Please find page 107 of the 2001 Bank of America annual report below. You can navigate through the pages in the report by either clicking on the pages listed below, or by using the keyword search tool below to find specific information within the annual report.-
 1
1 -
2
-
3
-
4
-
5
-
6
-
7
-
8
-
9
-
10
-
11
-
12
-
13
-
14
-
15
-
16
-
17
-
18
-
19
-
20
-
21
-
22
-
23
-
24
-
25
-
26
-
27
-
28
-
29
-
30
-
31
-
32
-
33
-
34
-
35
-
36
-
37
-
38
-
39
-
40
-
41
-
42
-
43
-
44
-
45
-
46
-
47
-
48
-
49
-
50
-
51
-
52
-
53
-
54
-
55
-
56
-
57
-
58
-
59
-
60
-
61
-
62
-
63
-
64
-
65
-
66
-
67
-
68
-
69
-
70
-
71
-
72
-
73
-
74
-
75
-
76
-
77
-
78
-
79
-
80
-
81
-
82
-
83
-
84
-
85
-
86
-
87
-
88
-
89
-
90
-
91
-
92
-
93
-
94
-
95
-
96
-
 97
97 -
 98
98 -
 99
99 -
 100
100 -
 101
101 -
 102
102 -
 103
103 -
 104
104 -
 105
105 -
 106
106 -
 107
107 -
 108
108 -
 109
109 -
 110
110 -
 111
111 -
 112
112 -
 113
113 -
 114
114 -
 115
115 -
 116
116 -
 117
117 -
118
-
119
-
120
-
121
-
122
-
123
-
124
 |
 |

BANK OF AMERICA 2001 ANNUAL REPORT
105
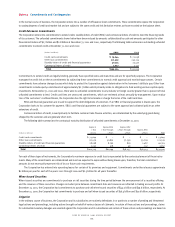
the premiums received are reflected as a component of other shareholders’ equity. At December 31, 2001, there were two million put options out-
standing with exercise prices ranging from $61.82 per share to $61.84 per share, all of which expire in September 2002. At December 31, 2000,
there were three million put options outstanding with exercise prices ranging from $45.22 per share to $50.37 per share, which expired from January
2001 to April 2001.
As of December 31, 2001, the Corporation had 1.5 million shares issued and outstanding of ESOP Convertible Preferred Stock, Series C (ESOP
Preferred Stock). The ESOP Preferred Stock has a stated and liquidation value of $42.50 per share, provides for an annual cumulative dividend of
$3.30 per share and each share is convertible into 1.68 shares of the Corporation’s common stock. ESOP Preferred Stock in the amounts of $7 million,
$5 million and $6 million was converted into the Corporation’s common stock in 2001, 2000 and 1999, respectively.
In November 1989, Barnett incorporated ESOP provisions into its existing 401(k) employee benefit plan (Barnett ESOP). The Barnett ESOP acquired
$141 million of common stock using the proceeds of a loan from the Corporation. This loan was repaid in 2000. The terms of the loan included equal
monthly payments of principal and interest through September 2015. Interest was at 9.75 percent and prepayments of principal were allowed. The
loan was generally repaid from contributions to the plan by the Corporation and dividends on unallocated shares held by the Barnett ESOP. Shares
held by the Barnett ESOP were allocated to plan participants as the loan was repaid. At December 31, 2001 and 2000, there were no shares of unallo-
cated common stock remaining in the Barnett ESOP. During 2000 and 1999, the Barnett ESOP released and allocated common stock amounting to
$32 million and $15 million, respectively.
The Corporation issues new shares of common stock under employee compensation plans which are discussed in Note Sixteen of the consolidated
financial statements. During 2001 and 2000, approximately 27 million and 4 million shares were issued under these plans primarily due to stock option
exercises and restricted stock activity, increasing shareholders’ equity by $1.1 billion and $294 million, respectively.
Gains (losses) of $1.9 billion, $2.8 billion and $(3.9) billion were recorded in other comprehensive income in 2001, 2000 and 1999, respectively.
Reclassification adjustments to net income of $715 million, $105 million and $240 million were recorded in 2001, 2000 and 1999, respectively. The
related income tax expense (benefit) was $30 million, $800 million and $(1.4) billion in 2001, 2000 and 1999, respectively.
Earnings per common share is computed by dividing net income available to common shareholders by the weighted average common shares
issued and outstanding. For diluted earnings per common share, net income available to common shareholders can be affected by the conversion of
the registrant’s convertible preferred stock. Where the effect of this conversion would have been dilutive, net income available to common shareholders
is adjusted by the associated preferred dividends. This adjusted net income is divided by the weighted average number of common shares issued and
outstanding for each period plus amounts representing the dilutive effect of stock options outstanding and the dilution resulting from the conversion
of the registrant’s convertible preferred stock, if applicable. The effects of convertible preferred stock and stock options are excluded from the
computation of diluted earnings per common share in periods in which the effect would be antidilutive.
In 2001, 2000 and 1999, options to purchase 79 million, 102 million and 44 million shares, respectively, were outstanding but not included in the
computation of earnings per share because they were antidilutive.
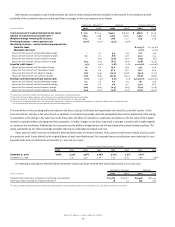
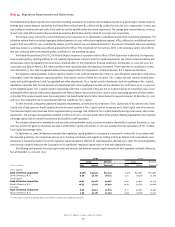
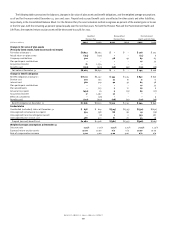
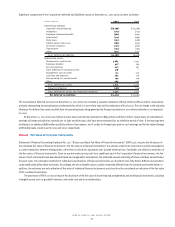
The calculation of earnings per common share and diluted earnings per common share for 2001, 2000 and 1999 is presented below:
(Dollars in millions, except per share information; shares in thousands)
2001 2000 1999
Earnings per common share
Net income $6,792 $ 7,517 $ 7,882
Preferred stock dividends (5) (6) (6)
Net income available to common shareholders $6,787 $ 7,511 $ 7,876
Average common shares issued and outstanding 1,594,957 1,646,398 1,726,006
Earnings per common share $4.26 $ 4.56 $ 4.56
Diluted earnings per common share
Net income available to common shareholders $6,787 $ 7,511 $ 7,876
Preferred stock dividends 566
Net income available to common shareholders and assumed conversions $6,792 $ 7,517 $ 7,882
Average common shares issued and outstanding 1,594,957 1,646,398 1,726,006
Incremental shares from assumed conversions:
Convertible preferred stock 2,666 2,926 3,006
Stock options 28,031 15,605 31,046
Dilutive potential common shares 30,697 18,531 34,052
Total diluted average common shares issued and outstanding 1,625,654 1,664,929 1,760,058
Diluted earnings per common share $4.18 $ 4.52 $ 4.48