Bank of America 2001 Annual Report Download - page 37
Download and view the complete annual report
Please find page 37 of the 2001 Bank of America annual report below. You can navigate through the pages in the report by either clicking on the pages listed below, or by using the keyword search tool below to find specific information within the annual report.-
 1
1 -
2
-
3
-
4
-
5
-
6
-
7
-
8
-
9
-
10
-
11
-
12
-
13
-
14
-
15
-
16
-
17
-
18
-
19
-
20
-
21
-
22
-
23
-
24
-
25
-
26
-
 27
27 -
 28
28 -
 29
29 -
 30
30 -
 31
31 -
 32
32 -
 33
33 -
 34
34 -
 35
35 -
 36
36 -
 37
37 -
 38
38 -
 39
39 -
 40
40 -
 41
41 -
 42
42 -
 43
43 -
 44
44 -
 45
45 -
 46
46 -
 47
47 -
48
-
49
-
50
-
51
-
52
-
53
-
54
-
55
-
56
-
57
-
58
-
59
-
60
-
61
-
62
-
63
-
64
-
65
-
66
-
67
-
68
-
69
-
70
-
71
-
72
-
73
-
74
-
75
-
76
-
77
-
78
-
79
-
80
-
81
-
82
-
83
-
84
-
85
-
86
-
87
-
88
-
89
-
90
-
91
-
92
-
93
-
94
-
95
-
96
-
97
-
98
-
99
-
100
-
101
-
102
-
103
-
104
-
105
-
106
-
107
-
108
-
109
-
110
-
111
-
112
-
113
-
114
-
115
-
116
-
117
-
118
-
119
-
120
-
121
-
122
-
123
-
124
 |
 |

BANK OF AMERICA 2001 ANNUAL REPORT
35
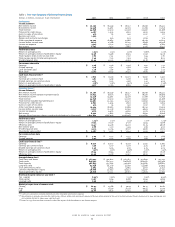
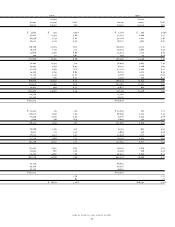
Table 1 Five-Year Summary of Selected Financial Data
(Dollars in millions, except per share information)
2001 2000 1999 1998 1997
As Reported
Income statement
Net interest income $ 20,290 $ 18,349 $ 18,127 $ 18,298 $ 18,432
Noninterest income 14,348 14,582 14,179 12,189 11,756
Total revenue 34,638 32,931 32,306 30,487 30,188
Provision for credit losses 4,287 2,535 1,820 2,920 1,904
Gains on sales of securities 475 25 240 1,017 271
Business exit costs 1,305 ––––
Merger and restructuring charges –550 525 1,795 374
Other noninterest expense 19,404 18,083 17,986 18,741 17,625
Income before income taxes 10,117 11,788 12,215 8,048 10,556
Income tax expense 3,325 4,271 4,333 2,883 4,014
Net income 6,792 7,517 7,882 5,165 6,542
Performance ratios
Return on average assets 1.05% 1.12% 1.28% 0.88% 1.20%
Return on average common shareholders’ equity 13.96 15.96 16.93 11.56 15.26
Total equity to total assets (at year end) 7.80 7.42 7.02 7.44 7.81
Total average equity to total average assets 7.49 7.02 7.55 7.67 8.02
Dividend payout ratio 53.44 45.02 40.54 50.18 32.09
Per common share data
Earnings $4.26 $ 4.56 $ 4.56 $ 2.97 $ 3.71
Diluted earnings 4.18 4.52 4.48 2.90 3.61
Cash dividends paid 2.28 2.06 1.85 1.59 1.37
Book value 31.07 29.47 26.44 26.60 25.49
Cash basis financial data(1)
Earnings $7,670 $ 8,381 $ 8,770 $ 6,067 $ 7,397
Earnings per common share 4.81 5.09 5.08 3.49 4.20
Diluted earnings per common share 4.72 5.03 4.98 3.41 4.09
Return on average assets 1.18% 1.25% 1.42% 1.04% 1.36%
Return on average common shareholders’ equity 15.77 17.80 18.85 13.64 17.55
Operating Basis(2)
Income statement
Net interest income $ 20,290 $ 18,349 $ 18,127 $ 18,298 $ 18,432
Net interest income (taxable-equivalent basis) 20,633 18,671 18,342 18,461 18,589
Noninterest income 14,348 14,582 14,179 12,189 11,756
Total revenue 34,638 32,931 32,306 30,487 30,188
Total revenue (taxable-equivalent basis) 34,981 33,253 32,521 30,650 30,345
Provision for credit losses 3,892 2,535 1,820 2,920 1,904
Gains on sales of securities 475 25 240 1,017 271
Other noninterest expense 19,404 18,083 17,986 18,741 17,625
Income before income taxes 11,817 12,338 12,740 9,843 10,930
Income tax expense 3,775 4,475 4,500 3,353 4,124
Net income 8,042 7,863 8,240 6,490 6,806
Average diluted common shares issued and outstanding (in thousands) 1,625,654 1,664,929 1,760,058 1,775,760 1,782,172
Performance ratios
Return on average assets 1.24% 1.17% 1.34% 1.11% 1.25%
Return on average common shareholders’ equity 16.53 16.70 17.70 14.54 15.88
Efficiency ratio 55.47 54.38 55.30 61.15 58.08
Net interest yield 3.68 3.20 3.45 3.69 4.00
Dividend payout ratio 45.13 43.04 38.77 39.90 30.83
Shareholder value added $3,087 $ 3,081 $ 3,544 $ 2,056 $ 2,603
Per common share data
Earnings $5.04 $4.77 $4.77 $3.73 $3.86
Diluted earnings 4.95 4.72 4.68 3.64 3.76
Cash basis financial data(1)
Earnings $ 8,920 $ 8,727 $ 9,128 $ 7,392 $ 7,661
Earnings per common share 5.59 5.305.284.254.36
Diluted earnings per common share 5.49 5.24 5.19 4.15 4.24
Return on average assets 1.37% 1.30% 1.48% 1.26% 1.41%
Return on average common shareholders’ equity 18.34 18.54 19.62 16.62 18.18
Efficiency ratio 52.96 51.78 52.57 58.20 55.27
Average balance sheet
Total loans and leases $ 365,447 $ 392,622 $ 362,783 $ 347,840 $ 343,151
Total assets 649,547 671,573 616,838 584,487 543,796
Total deposits 362,653 353,294 341,748 345,485 336,883
Long-term debt 64,638 65,338 52,619 45,098 41,984
Trust preferred securities 4,984 4,955 4,955 4,871 4,353
Common shareholders’ equity 48,609 47,057 46,527 44,467 42,151
Total shareholders’ equity 48,678 47,132 46,601 44,829 43,610
Risk-based capital ratios (at year end)(3)
Tier 1 capital 8.30% 7.50% 7.35% 7.06% 6.50%
Total capital 12.67 11.04 10.88 10.94 10.89
Leverage ratio 6.56 6.12 6.26 6.22 5.57
Market price per share of common stock
Closing $ 62.95 $ 45.88 $ 50.19 $ 60.13 $ 60.81
High 65.54 61.00 76.38 88.44 71.69
Low 45.00 36.31 47.63 44.00 48.00
(1) Cash basis calculations exclude goodwill and other intangible amortization expense.
(2) Operating basis excludes provision for credit losses of $395 million and noninterest expense of $1,305 million related to the exit of certain consumer finance businesses in 2001 and merger and
restructuring charges in 2000, 1999, 1998 and 1997.
(3) Ratios for 1997 have not been restated to reflect the impact of the BankAmerica and Barnett mergers.