Bank of America 2001 Annual Report Download - page 67
Download and view the complete annual report
Please find page 67 of the 2001 Bank of America annual report below. You can navigate through the pages in the report by either clicking on the pages listed below, or by using the keyword search tool below to find specific information within the annual report.-
 1
1 -
2
-
3
-
4
-
5
-
6
-
7
-
8
-
9
-
10
-
11
-
12
-
13
-
14
-
15
-
16
-
17
-
18
-
19
-
20
-
21
-
22
-
23
-
24
-
25
-
26
-
27
-
28
-
29
-
30
-
31
-
32
-
33
-
34
-
35
-
36
-
37
-
38
-
39
-
40
-
41
-
42
-
43
-
44
-
45
-
46
-
47
-
48
-
49
-
50
-
51
-
52
-
53
-
54
-
55
-
56
-
 57
57 -
 58
58 -
 59
59 -
 60
60 -
 61
61 -
 62
62 -
 63
63 -
 64
64 -
 65
65 -
 66
66 -
 67
67 -
 68
68 -
 69
69 -
 70
70 -
 71
71 -
 72
72 -
 73
73 -
 74
74 -
 75
75 -
 76
76 -
 77
77 -
78
-
79
-
80
-
81
-
82
-
83
-
84
-
85
-
86
-
87
-
88
-
89
-
90
-
91
-
92
-
93
-
94
-
95
-
96
-
97
-
98
-
99
-
100
-
101
-
102
-
103
-
104
-
105
-
106
-
107
-
108
-
109
-
110
-
111
-
112
-
113
-
114
-
115
-
116
-
117
-
118
-
119
-
120
-
121
-
122
-
123
-
124
 |
 |
BANK OF AMERICA 2001 ANNUAL REPORT
65
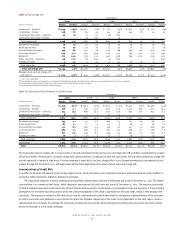
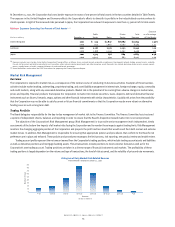
Market risk-related revenue includes trading account profits and trading-related net interest income, which encompass both proprietary
trading and customer-related activities. During 2001, the Corporation has continued its efforts to build on its client franchise and reduce the proportion
of proprietary trading revenue to total revenue. The results of these efforts can be seen in the histogram above. In 2001, the Corporation recorded
positive daily market risk-related revenue for 221 of 250 trading days. Furthermore, of the 29 days that showed negative revenue, only 11 days were
greater than $10 million.
Value at Risk
Value at Risk (VAR) is the key measure of market risk for the Corporation. VAR represents the maximum amount that the Corporation has placed at
risk of loss, with a 99 percent degree of confidence, in the course of its risk taking activities. Its purpose is to describe the amount of capital required
to absorb potential losses from adverse market movements. Given the 99 percent confidence interval captured by VAR, market risk-related revenue or
losses would be expected to exceed VAR measures approximately once every 100 trading days, or two to three times each year. The VAR model does
not measure the degree of the excess gain or loss, rather it produces a confidence level that gains or losses will be within predicted ranges. Since the
third quarter of 2000, the Corporation has been migrating its trading books to a historical simulation approach. This approach utilizes historical market
conditions over the last three years to derive estimates of trading risk and provides for the natural aggregation of trading risks across different groups.
The effects of correlation and diversification are embedded in these calculations. The completion of the migration is expected to take place during the
first half of 2002. While the transition is taking place, the square root of the sum of squares method is used to aggregate risk.
VAR modeling on trading is subject to numerous limitations. In addition, the Corporation recognizes that there are numerous assumptions and
estimates associated with modeling and actual results could differ from these assumptions and estimates. The Corporation mitigates these uncertainties
through close monitoring and by examining and updating assumptions on an ongoing basis. The continual trading risk management process considers
the impact of unanticipated risk exposure and updates assumptions to reduce loss exposure.
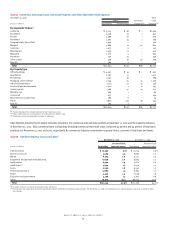
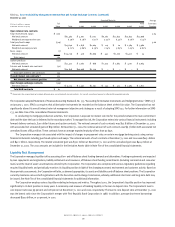
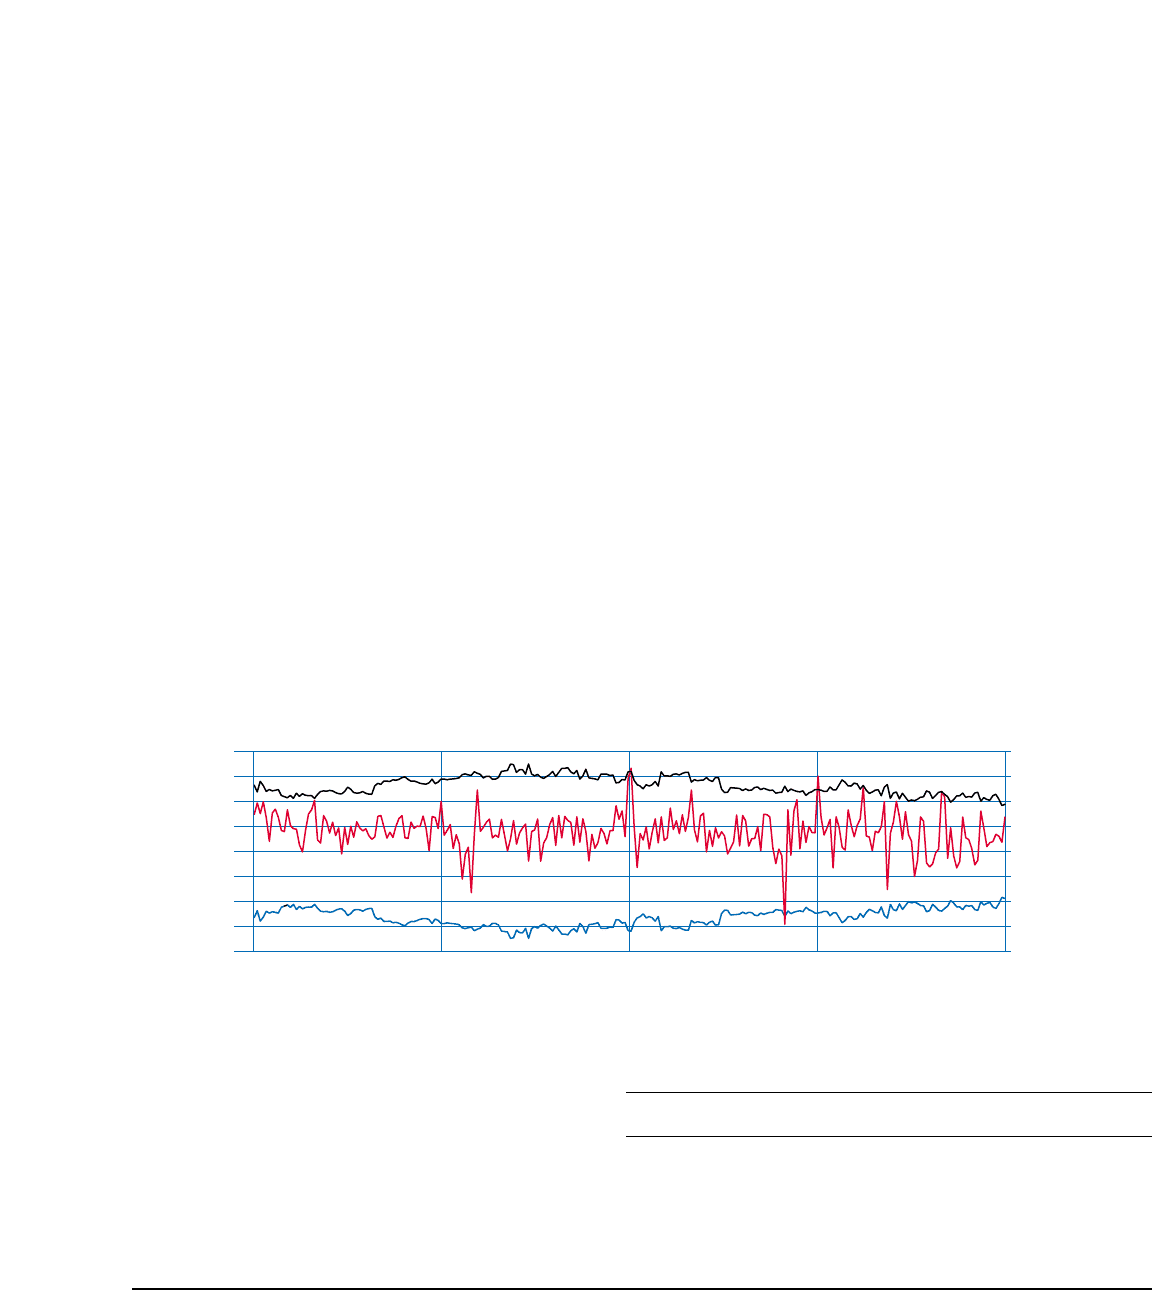
As the following graph shows, in 2001, actual market risk-related revenue exceeded VAR measures three days out of 250 total trading days.
During the same period, actual market risk-related losses exceeded VAR measures one day out of 250 total trading days. This occurred immediately
following the events of September 11, 2001 due to extreme market conditions.
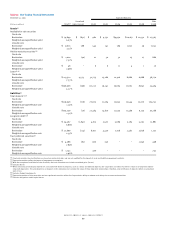
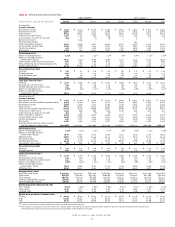
The following table summarizes the VAR in the Corporation’s trading portfolios for the years ended December 31, 2001 and 2000:
Table 21 Trading Activities Market Risk
2001 2000
Average High Low Average High Low
(US Dollar equivalents in millions)
VAR
(1)
VAR
(2)
VAR
(2)
VAR
(1)
VAR
(2)
VAR
(2)
Interest rate $34.3 $47.0 $23.0 $25.9 $42.2 $16.3
Foreign exchange 7.2 12.8 1.9 10.6 18.5 5.4
Commodities 4.3 10.9 .9 2.1 5.2 .5
Equities 15.4 25.1 8.9 26.7 41.5 5.5
Fixed income 10.9 17.3 3.0 10.1 17.4 3.2
Real estate/mortgage(3) 33.2 55.5 8.8 7.5 11.3 2.5
Total trading portfolio 52.7 69.9 35.8 41.5 53.0 25.1
(1) The average VAR for the total portfolio is less than the sum of the VARs of the individual portfolios due to risk offsets arising from the diversification of the portfolio.
(2) The high and low for the total portfolio may not equal the sum of the individual components as the highs or lows of the individual portfolios may have occurred on different trading days.
(3) The real estate/mortgage business is included in the fixed income category in the Trading-Related Revenue table in Note Four of the consolidated financial statements.
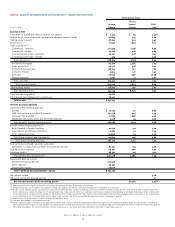
(Dollars in millions)
Trading Risk and Return
Daily VAR and Market Risk-Related Revenue
12/31/00 3/31/01 6/30/01 9/30/01 12/31/01
VAR
(absolute value)
Daily Market
Risk-Related
Revenue
VAR
-80
60
0
-20
-40
-60
20
40
80