Bank of America 2001 Annual Report Download - page 72
Download and view the complete annual report
Please find page 72 of the 2001 Bank of America annual report below. You can navigate through the pages in the report by either clicking on the pages listed below, or by using the keyword search tool below to find specific information within the annual report.-
 1
1 -
2
-
3
-
4
-
5
-
6
-
7
-
8
-
9
-
10
-
11
-
12
-
13
-
14
-
15
-
16
-
17
-
18
-
19
-
20
-
21
-
22
-
23
-
24
-
25
-
26
-
27
-
28
-
29
-
30
-
31
-
32
-
33
-
34
-
35
-
36
-
37
-
38
-
39
-
40
-
41
-
42
-
43
-
44
-
45
-
46
-
47
-
48
-
49
-
50
-
51
-
52
-
53
-
54
-
55
-
56
-
57
-
58
-
59
-
60
-
61
-
 62
62 -
 63
63 -
 64
64 -
 65
65 -
 66
66 -
 67
67 -
 68
68 -
 69
69 -
 70
70 -
 71
71 -
 72
72 -
 73
73 -
 74
74 -
 75
75 -
 76
76 -
 77
77 -
 78
78 -
 79
79 -
 80
80 -
 81
81 -
 82
82 -
83
-
84
-
85
-
86
-
87
-
88
-
89
-
90
-
91
-
92
-
93
-
94
-
95
-
96
-
97
-
98
-
99
-
100
-
101
-
102
-
103
-
104
-
105
-
106
-
107
-
108
-
109
-
110
-
111
-
112
-
113
-
114
-
115
-
116
-
117
-
118
-
119
-
120
-
121
-
122
-
123
-
124
 |
 |

BANK OF AMERICA 2001 ANNUAL REPORT
70
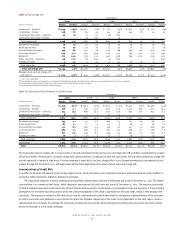
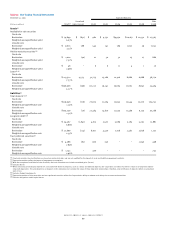
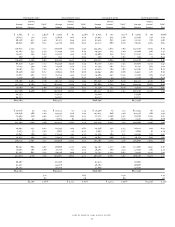
Table 24 Asset and Liability Management Interest Rate and Foreign Exchange Contracts (continued)
December 31, 2000
Expected Maturity Average
(Dollars in millions, average
Fair After Estimated
estimated duration in years)
Value Total 2001 2002 2003 2004 2005 2005 Duration
Open interest rate contracts
Total receive fixed swaps $ 900 3.65
Notional amount $62,485 $ 4,001 $ 7,011 $9,787 $12,835 $15,853 $12,998
Weighted average receive rate 6.39% 6.28% 6.71% 5.53% 6.45% 6.76% 6.41%
Total pay fixed swaps (529) 5.66
Notional amount $13,640 $ 1,878 $1,064 $ 114 $ 20 $ 2,584 $ 7,980
Weighted average pay rate 6.72% 5.86% 6.39% 7.14% 5.85% 7.05% 6.82%
Basis swaps (7)
Notional amount $ 14,739 $ 576 $1,669 $ 442 $7,700 $ 4,317 $ 35
Total swaps 364
Option products (157)
Notional amount $22,477 $ 2,087 $ 868 $1,575 $ 7,882 $ 4,101 $ 5,964
Futures and forward rate contracts (52)
Notional amount $24,818 $19,068 $5,750 $ – $ – $ – $ –
Total open interest rate contracts 155
Closed interest rate contracts(1) 105
Net interest rate contract position 260
Open foreign exchange contracts (199)
Notional amount $ 9,373 $ 1,597 $2,091 $ 253 $ 572 $ 2,983 $ 1,877
Total ALM contracts $61
(1) Represents the unamortized net realized deferred gains associated with closed contracts. As a result, no notional amount is reflected for expected maturity.
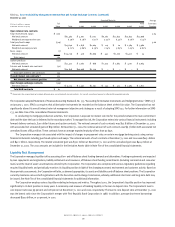
The Corporation adopted Statement of Financial Accounting Standards No. 133, “Accounting for Derivative Instruments and Hedging Activities,” (SFAS 133)
on January 1, 2001. SFAS 133 requires that all derivative instruments be recorded on the balance sheet at their fair value. The Corporation has not
significantly altered its overall interest rate risk management objective and strategy as a result of adopting SFAS 133. For further information on SFAS
133, see Note One of the consolidated financial statements.
In conducting its mortgage production activities, the Corporation is exposed to interest rate risk for the periods between the loan commitment
date and the date the loan is delivered to the secondary market. To manage this risk, the Corporation enters into various financial instruments including
forward delivery contracts, Euro dollar futures and option contracts. The notional amount of such contracts was $27.8 billion at December 31, 2001
with associated net unrealized gains of $69 million. At December 31, 2000, the notional amount of such contracts was $9.7 billion with associated net
unrealized losses of $53 million. These contracts have an average expected maturity of less than 90 days.
The Corporation manages risk associated with the impact of changes in prepayment rates on certain mortgage banking assets using various
financial instruments including purchased options and swaps. The notional amounts of such contracts at December 31, 2001 and 2000 were $65.1 billion
and $42.1 billion, respectively. The related unrealized gain was $301 million at December 31, 2001 and the unrealized gain was $424 million at
December 31, 2000. The 2001 amounts are included in the Derivative Assets table in Note Five of the consolidated financial statements.
Liquidity Risk Management
The Corporation manages liquidity risk by assessing all on- and off-balance sheet funding demands and alternatives. Funding requirements are impacted
by loan repayments and originations, liability settlements and issuances, off-balance sheet funding commitments (including commercial and consumer
loans) and the level of asset securitizations utilized by the Corporation. The Corporation also complies with various regulatory guidelines regarding
required liquidity levels and periodically monitors its liquidity position in light of the changing economic environment and customer activity. Based on
these periodic assessments, the Corporation will alter, as deemed appropriate, its assets and liabilities and off-balance sheet positions. The Corporation
currently maintains various shelf registrations with the Securities and Exchange Commission, whereby additional short-term and long-term debt may
be issued. See Note Ten of the consolidated financial statements for additional information.
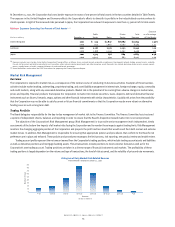
The Corporation employs various liquidity modeling techniques and metrics. Throughout 2001, the Corporation’s liquidity position has improved
significantly to its best position in many years. A commonly used measure of banking liquidity is the loan to deposit ratio. The Corporation’s loan to
core deposit ratio was 99 percent and 128 percent at December 31, 2001 and 2000, respectively. The loan to core deposit ratio at December 31, 2001
was the lowest ratio since the Corporation’s merger with First Republic Bank Corporation in 1988. In addition, average short-term borrowings
decreased $39.0 billion, or 30 percent, in 2001.