Bank of America 2001 Annual Report Download - page 3
Download and view the complete annual report
Please find page 3 of the 2001 Bank of America annual report below. You can navigate through the pages in the report by either clicking on the pages listed below, or by using the keyword search tool below to find specific information within the annual report.-
 1
1 -
 2
2 -
 3
3 -
 4
4 -
 5
5 -
 6
6 -
 7
7 -
 8
8 -
 9
9 -
 10
10 -
 11
11 -
 12
12 -
 13
13 -
 14
14 -
15
-
16
-
17
-
18
-
19
-
20
-
21
-
22
-
23
-
24
-
25
-
26
-
27
-
28
-
29
-
30
-
31
-
32
-
33
-
34
-
35
-
36
-
37
-
38
-
39
-
40
-
41
-
42
-
43
-
44
-
45
-
46
-
47
-
48
-
49
-
50
-
51
-
52
-
53
-
54
-
55
-
56
-
57
-
58
-
59
-
60
-
61
-
62
-
63
-
64
-
65
-
66
-
67
-
68
-
69
-
70
-
71
-
72
-
73
-
74
-
75
-
76
-
77
-
78
-
79
-
80
-
81
-
82
-
83
-
84
-
85
-
86
-
87
-
88
-
89
-
90
-
91
-
92
-
93
-
94
-
95
-
96
-
97
-
98
-
99
-
100
-
101
-
102
-
103
-
104
-
105
-
106
-
107
-
108
-
109
-
110
-
111
-
112
-
113
-
114
-
115
-
116
-
117
-
118
-
119
-
120
-
121
-
122
-
123
-
124
 |
 |

1
In 2001, your company achieved solid financial results
despite a weak economic environment and took major
steps to accelerate internal growth, improve business
execution and focus activities ever more tightly on the
needs of our customers.
>
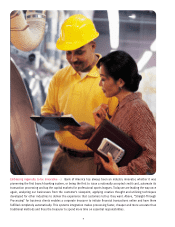
Associates accelerated work to attract, retain and
deepen customer relationships and to improve customer and
client service throughout the company.
>
We launched a company-wide Six Sigma
quality and productivity program and continued
to reinvest savings in high-growth opportunities.
>
We installed a new business planning
process and a new approach to risk management
that we believe will bring consistency and pre-
dictability to our earnings.
>
We hired teammates from different indus-
tries who brought new skills to our company.
>
We adopted shareholder value added (SVA)
as a measurement tool to bring more financial
discipline to our business decisions.
>
We continued to invest aggressively in
efforts to build the Bank of America brand.
In short, we are combining our heritage of
ingenuity with an emerging culture based on
focus and discipline, consistent execution and
sustained intensity to serve customers better
while at the same time producing strong growth in total
shareholder returns.
Building Momentum.
Our associates’ hard work in
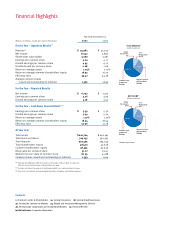
2001 paid off, as revenue increased 5% to $35 billion,
leading to an operating earnings increase of 2% to $8
billion, both impressive figures taking into account rising
credit costs and the faltering economy. The lion’s share of
earnings growth came from Consumer and
Commercial
Banking, which posted earnings of $4.8 billion, up 6.4%
from 2000, driven mostly by gains in net interest income,
service charges, card services and mortgage banking.
Global Corporate and Investment Banking earnings rose
6.8% to $1.9 billion, reflecting an increase in fixed-income
originations and increased market share in every major
category of capital-raising transactions. Turmoil in the
markets dampened results in the Asset Management Group,
which held revenues steady, but saw earnings fall 11.5%
to $521 million due to increased investments in the busi-
ness. Equity Investments recorded a loss of $94 million.
While our core businesses performed well, we made a
strategic decision in the third quarter to exit the
subprime real estate and auto leasing busi-
nesses, both of which tended to produce volatile
earnings and did not fit our objectives for prof-
itability. We took a $1.3 billion after-tax charge
to cover the costs of exiting these businesses.
Credit costs continued to be our greatest
drag on earnings. N
et charge-offs, excluding
charge-offs related to the exit of the subprime
lending business, totaled $3.6 billion, or .99%
of loans and leases, compared to $2.4 billion,
or .61%, the year before. Deteriorating credit
quality was largely limited to the corporate
sector in the first half of 2001, but spread to
the consumer sector as the
recession deepened.
We expect
credit costs to remain high in 2002.
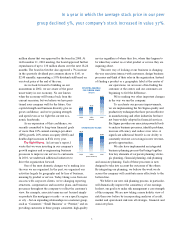
The bottom line for shareholders, of course,
is our stock price, and in 2001, we stood head
and shoulders above the rest of the class. In a
year in which the average stock price in our
peer group declined 5%, your company’s stock increased
in value 37%.
Two reasons for heightened investor confidence have
been
our disciplined approach to balance sheet management
and
our commitment to returning capital to shareholders.
Throughout the company, we used relationship-banking
and pricing incentives to boost deposits. At the
same time,
we reduced low-returning corporate loans on our balance
sheet. The result is a loan-to-deposit
ratio that today is lower
than 1:1, which reduces inherent
interest rate risk and
enhances our ability to control funding
costs in the future.
We also continued to
return capital to shareholders in 2001,
nearly
exhausting the stock repurchase program of 100
Chairman’s Letter to Shareholders
NONINTEREST EXPENSE
(Operating Basis)
1999 2000 2001
(Dollars in billions)
$18.0 $18.1
$19.4
REVENUE
(Taxable Equivalent Basis)
1999 2000 2001
(Dollars in billions)
$32.5
$33.3
$35.0