Bank of America 2001 Annual Report Download - page 51
Download and view the complete annual report
Please find page 51 of the 2001 Bank of America annual report below. You can navigate through the pages in the report by either clicking on the pages listed below, or by using the keyword search tool below to find specific information within the annual report.-
 1
1 -
2
-
3
-
4
-
5
-
6
-
7
-
8
-
9
-
10
-
11
-
12
-
13
-
14
-
15
-
16
-
17
-
18
-
19
-
20
-
21
-
22
-
23
-
24
-
25
-
26
-
27
-
28
-
29
-
30
-
31
-
32
-
33
-
34
-
35
-
36
-
37
-
38
-
39
-
40
-
 41
41 -
 42
42 -
 43
43 -
 44
44 -
 45
45 -
 46
46 -
 47
47 -
 48
48 -
 49
49 -
 50
50 -
 51
51 -
 52
52 -
 53
53 -
 54
54 -
 55
55 -
 56
56 -
 57
57 -
 58
58 -
 59
59 -
 60
60 -
 61
61 -
62
-
63
-
64
-
65
-
66
-
67
-
68
-
69
-
70
-
71
-
72
-
73
-
74
-
75
-
76
-
77
-
78
-
79
-
80
-
81
-
82
-
83
-
84
-
85
-
86
-
87
-
88
-
89
-
90
-
91
-
92
-
93
-
94
-
95
-
96
-
97
-
98
-
99
-
100
-
101
-
102
-
103
-
104
-
105
-
106
-
107
-
108
-
109
-
110
-
111
-
112
-
113
-
114
-
115
-
116
-
117
-
118
-
119
-
120
-
121
-
122
-
123
-
124
 |
 |

BANK OF AMERICA 2001 ANNUAL REPORT
49
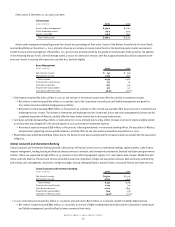
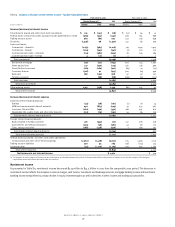
Provision for Credit Losses
The provision for credit losses totaled $3.9 billion for the year ended December 31, 2001 compared to $2.5 billion in 2000, excluding the impact of
charges related to the exit of the subprime real estate lending business. The increase in the provision for credit losses from last year was primarily
due to an increase in net charge-offs, which included $210 million in charge-offs in the fourth quarter of 2001 related to Enron Corporation. Additional
provision expense was also recorded in 2001 to increase the allowance for credit losses due to deterioration in credit quality and the overall uncertainty
in the economy. Excluding the impact of subprime real estate exit-related charges, the provision for credit losses for 2001 was $283 million in excess
of net charge-offs. Total net charge-offs, excluding the impact of exit-related charges, were $3.6 billion for the year ended December 31, 2001 compared
to $2.4 billion in 2000. This increase was due to higher charge-offs in the commercial – domestic portfolio due to a deterioration in credit quality
stemming from the weak economic environment. Bankcard charge-offs also increased due to growth in the portfolio, an increase in personal bankruptcy
filings and a weaker economic environment.
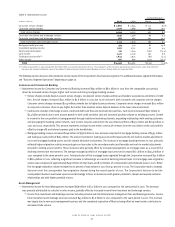
An exit-related provision for credit losses of $395 million, combined with an existing allowance for credit losses of $240 million, was used to
write down the subprime real estate loan portfolio to estimated market value in the third quarter of 2001. This resulted in charge-offs of $635 million
in the consumer finance loan portfolio. Including the exit impact, the provision for credit losses totaled $4.3 billion and total net charge-offs were
$4.2 billion for the year ended December 31, 2001.
For additional information on the allowance for credit losses, certain credit quality ratios and credit quality information on specific loan
categories, see the “Credit Risk Management and Credit Portfolio Review” section beginning on page 54.
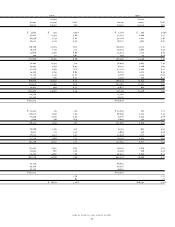
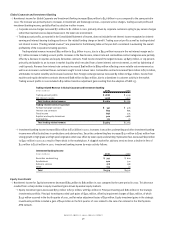
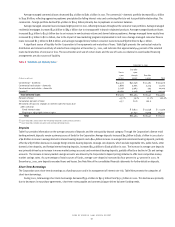
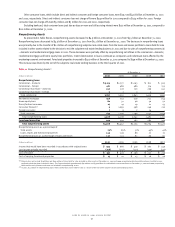
Noninterest Expense
As presented in Table Seven, the Corporation’s noninterest expense increased $2.1 billion to $20.7 billion in 2001. This increase in noninterest
expense was driven by business exit costs, higher other general operating expense, personnel, professional fees, data processing and marketing,
reflecting investments in growth businesses such as e-commerce, Asset Management and card and payment businesses.
Table 7 Noninterest Expense
2001 2000 Increase/(Decrease)
(Dollars in millions)
Amount Percent
(1)
Amount Percent
(1)
Amount Percent
Personnel $ 9,829 28.1% $ 9,400 28.2% $ 429 4.6%
Occupancy 1,774 5.1 1,682 5.0 92 5.5
Equipment 1,115 3.2 1,173 3.5 (58) (4.9)
Marketing 682 1.9 621 1.9 61 9.8
Professional fees 564 1.6 452 1.4 112 24.8
Amortization of intangibles 878 2.5 864 2.6 14 1.6
Data processing 776 2.2 667 2.0 109 16.3
Telecommunications 484 1.4 527 1.6 (43) (8.2)
Other general operating 2,687 7.7 2,114 6.4 573 27.1
General administrative and other 615 1.8 583 1.8 32 5.5
Business exit costs 1,305 3.7 – – 1,305 n/m
Restructuring charges ––550 1.7 (550) n/m
Total $20,709 59.2% $18,633 56.0% $2,076 11.1%
(1) Percent of net interest income on a taxable-equivalent basis and noninterest income.
>Personnel expense increased $429 million to $9.8 billion in 2001, primarily due to a severance charge of $150 million in the fourth quarter of
2001 related to ongoing efficiency improvement programs, higher revenue-related incentive compensation and increased salaries expense.
The Corporation had approximately 143,000 full-time equivalent employees at both December 31, 2001 and 2000.
>Marketing expense increased $61 million to $682 million for 2001, primarily due to the Corporation’s national brand-building campaign and higher
card marketing in Consumer and Commercial Banking.
>Professional fees increased $112 million to $564 million for 2001, primarily reflecting higher consulting and other professional fees due to an
increase in initiatives related to the Corporation’s strategy to improve customer satisfaction, the launch of a company-wide Six Sigma quality and
productivity program and implementation of a new integrated business planning process.
>Data processing expense increased $109 million to $776 million for 2001, primarily due to higher outsourced processing expense as a result of the
outsourcing of personnel services and higher item processing and check clearing expenses.
>Other general operating expense increased $573 million to $2.7 billion in 2001, reflecting $334 million in litigation expenses in the fourth quarter
of 2001 related to small settlements and an addition to the legal reserve to cover increased exposure to existing litigation, foreclosed properties
expense in Corporate Other and other miscellaneous expenses throughout the Corporation.