Bank of America 2001 Annual Report Download - page 53
Download and view the complete annual report
Please find page 53 of the 2001 Bank of America annual report below. You can navigate through the pages in the report by either clicking on the pages listed below, or by using the keyword search tool below to find specific information within the annual report.-
 1
1 -
2
-
3
-
4
-
5
-
6
-
7
-
8
-
9
-
10
-
11
-
12
-
13
-
14
-
15
-
16
-
17
-
18
-
19
-
20
-
21
-
22
-
23
-
24
-
25
-
26
-
27
-
28
-
29
-
30
-
31
-
32
-
33
-
34
-
35
-
36
-
37
-
38
-
39
-
40
-
41
-
42
-
 43
43 -
 44
44 -
 45
45 -
 46
46 -
 47
47 -
 48
48 -
 49
49 -
 50
50 -
 51
51 -
 52
52 -
 53
53 -
 54
54 -
 55
55 -
 56
56 -
 57
57 -
 58
58 -
 59
59 -
 60
60 -
 61
61 -
 62
62 -
 63
63 -
64
-
65
-
66
-
67
-
68
-
69
-
70
-
71
-
72
-
73
-
74
-
75
-
76
-
77
-
78
-
79
-
80
-
81
-
82
-
83
-
84
-
85
-
86
-
87
-
88
-
89
-
90
-
91
-
92
-
93
-
94
-
95
-
96
-
97
-
98
-
99
-
100
-
101
-
102
-
103
-
104
-
105
-
106
-
107
-
108
-
109
-
110
-
111
-
112
-
113
-
114
-
115
-
116
-
117
-
118
-
119
-
120
-
121
-
122
-
123
-
124
 |
 |

BANK OF AMERICA 2001 ANNUAL REPORT
51
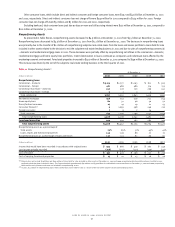
Average managed commercial loans decreased $15.3 billion to $187.2 billion in 2001. The commercial – domestic portfolio decreased $12.2 billion
to $135.8 billion, reflecting aggressive paydowns precipitated by falling interest rates and continuing efforts to exit less profitable relationships. The
commercial – foreign portfolio declined $2.4 billion to $26.5 billion primarily due to paydowns on customer balances.
Average managed consumer loans increased eight percent in 2001, reflecting increases throughout the consumer loan portfolios. Average managed
residential mortgages increased $4.6 billion to $84.0 billion due to strong growth in branch-originated products. Average managed bankcard loans
increased $4.4 billion to $24.6 billion due to an increase in new business volume and slower balance paydowns. Average managed home equity lines
increased $2.5 billion to $22.0 billion, due to the impact of new marketing programs implemented in mid 2000. Average managed consumer finance
loans increased $2.3 billion to $18.6 billion, and average managed direct/indirect consumer loans increased $308 million to $40.1 billion.
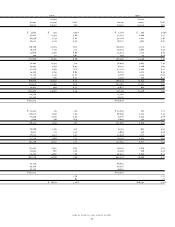
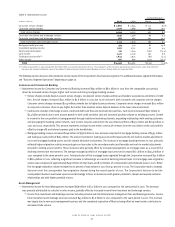
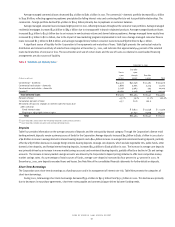
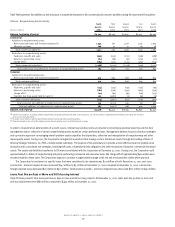
A significant source of liquidity for the Corporation is the repayments and maturities of loans. Table Eight presents the contractual maturity
distribution and interest sensitivity of selected loan categories at December 31, 2001, and indicates that approximately 44 percent of the selected
loans had maturities of one year or less. The securitization and sale of certain loans and the use of loans as collateral in asset-backed financing
arrangements are also sources of liquidity.
Table 8 Selected Loan Maturity Data(1)
December 31, 2001
Due after
Due in 1 year
1 year through Due after
(Dollars in millions)
or less 5 years 5 years Total
Commercial – domestic $42,536 $47,058 $ 21,382 $ 110,976
Commercial real estate – domestic 2,888 5,905 3,374 12,167
Construction real estate – domestic 5,748 3,963 393 10,104
Foreign(2) 16,389 3,538 1,408 21,335
Total selected loans $67,561 $60,464 $26,557 $154,582
Percent of total 43.7% 39.1% 17.2% 100.0%
Cumulative percent of total 43.7 82.8 100.0
Sensitivity of loans to changes in interest rates for loans due
after one year:
Fixed interest rates $ 8,821 $12,648 $ 21,469
Floating or adjustable interest rates 51,643 13,909 65,552
Total $60,464 $26,557 $ 87,021
(1) Loan maturities are based on the remaining maturities under contractual terms.
(2) Loan maturities include consumer and commercial foreign loans.
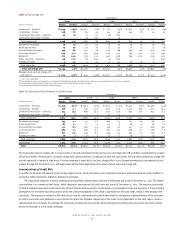
Deposits
Table Four provides information on the average amounts of deposits and the rates paid by deposit category. Through the Corporation’s diverse retail
banking network, deposits remain a primary source of funds for the Corporation. Average deposits increased $9.4 billion to $362.7 billion in 2001 due to
a $6.8 billion increase in average domestic interest-bearing deposits and a $6.4 billion increase in average total noninterest-bearing deposits, partially
offset by a $3.8 billion decrease in average foreign interest-bearing deposits. Average core deposits, which exclude negotiable CDs, public funds, other
domestic time deposits, and foreign interest-bearing deposits, increased $14.9 billion to $306.9 billion in 2001. The increase in average core deposits
was primarily driven by an increase in money market savings accounts and noninterest-bearing deposits, partially offset by a decline in CDs and savings
accounts. The increase in money market savings accounts was driven by the Corporation’s deposit pricing initiative to offer more competitive money
market savings rates. As a percentage of total sources of funds, average core deposits increased by four percent to 47 percent in 2001. At
December 31, 2001, core deposits exceeded loans and leases. See Note Nine of the consolidated financial statements for further details on deposits.
Short-Term Borrowings
The Corporation uses short-term borrowings as a funding source and in its management of interest rate risk. Table Nine presents the categories of
short-term borrowings.
During 2001, total average short-term borrowings decreased $39.0 billion to $92.5 billion from $131.5 billion in 2000. This decline was primarily
due to decreases in repurchase agreements, short-term notes payable and commercial paper driven by lower funding needs.