Bank of America 2001 Annual Report Download - page 46
Download and view the complete annual report
Please find page 46 of the 2001 Bank of America annual report below. You can navigate through the pages in the report by either clicking on the pages listed below, or by using the keyword search tool below to find specific information within the annual report.-
 1
1 -
2
-
3
-
4
-
5
-
6
-
7
-
8
-
9
-
10
-
11
-
12
-
13
-
14
-
15
-
16
-
17
-
18
-
19
-
20
-
21
-
22
-
23
-
24
-
25
-
26
-
27
-
28
-
29
-
30
-
31
-
32
-
33
-
34
-
35
-
 36
36 -
 37
37 -
 38
38 -
 39
39 -
 40
40 -
 41
41 -
 42
42 -
 43
43 -
 44
44 -
 45
45 -
 46
46 -
 47
47 -
 48
48 -
 49
49 -
 50
50 -
 51
51 -
 52
52 -
 53
53 -
 54
54 -
 55
55 -
 56
56 -
57
-
58
-
59
-
60
-
61
-
62
-
63
-
64
-
65
-
66
-
67
-
68
-
69
-
70
-
71
-
72
-
73
-
74
-
75
-
76
-
77
-
78
-
79
-
80
-
81
-
82
-
83
-
84
-
85
-
86
-
87
-
88
-
89
-
90
-
91
-
92
-
93
-
94
-
95
-
96
-
97
-
98
-
99
-
100
-
101
-
102
-
103
-
104
-
105
-
106
-
107
-
108
-
109
-
110
-
111
-
112
-
113
-
114
-
115
-
116
-
117
-
118
-
119
-
120
-
121
-
122
-
123
-
124
 |
 |

BANK OF AMERICA 2001 ANNUAL REPORT
44
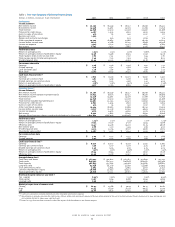
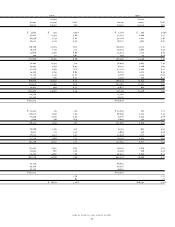
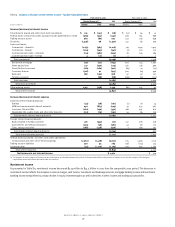
Table 4 Average Balances and Interest Rates – Taxable-Equivalent Basis
2001
Interest
Average Income/ Yield/
(Dollars in millions) Balance Expense Rate
Earning assets
Time deposits placed and other short-term investments $ 6,723 $ 318 4.73%
Federal funds sold and securities purchased under agreements to resell 35,202 1,414 4.02
Trading account assets 66,418 3,653 5.50
Securities(1) 60,372 3,761 6.23
Loans and leases(2):
Commercial – domestic 133,569 9,879 7.40
Commercial – foreign 26,492 1,567 5.90
Commercial real estate – domestic 24,607 1,700 6.91
Commercial real estate – foreign 348 20 6.08
Total commercial 185,016 13,166 7.12
Residential mortgage 81,472 5,920 7.27
Home equity lines 22,013 1,625 7.38
Direct/Indirect consumer 39,528 3,025 7.65
Consumer finance 18,555 1,683 9.07
Bankcard 16,641 1,879 11.29
Foreign consumer 2,222 127 5.80
Total consumer 180,431 14,259 7.90
Total loans and leases 365,447 27,425 7.50
Other earning assets 26,154 2,065 7.90
Total earning assets(3) 560,316 38,636 6.90
Cash and cash equivalents 22,542
Other assets, less allowance for credit losses 66,689
Total assets $649,547
Interest-bearing liabilities
Domestic interest-bearing deposits:
Savings $ 20,208 213 1.05
NOW and money market deposit accounts 114,657 2,498 2.18
Consumer CDs and IRAs 74,458 3,853 5.17
Negotiable CDs, public funds and other time deposits 5,848 290 4.96
Total domestic interest-bearing deposits 215,171 6,854 3.19
Foreign interest-bearing deposits(4):
Banks located in foreign countries 23,397 1,053 4.49
Governments and official institutions 3,615 152 4.21
Time, savings and other 22,940 827 3.62
Total foreign interest-bearing deposits 49,952 2,032 4.07
Total interest-bearing deposits 265,123 8,886 3.35
Federal funds purchased, securities sold under agreements
to repurchase and other short-term borrowings 92,476 4,167 4.51
Trading account liabilities 29,995 1,155 3.85
Long-term debt(5) 69,622 3,795 5.45
Total interest-bearing liabilities(6) 457,216 18,003 3.94
Noninterest-bearing sources:
Noninterest-bearing deposits 97,529
Other liabilities 46,124
Shareholders’ equity 48,678
Total liabilities and shareholders’ equity $649,547
Net interest spread 2.96
Impact of noninterest-bearing sources .72
Net interest income/yield on earning assets $ 20,633 3.68%
(1) The average balance and yield on securities are based on the average of historical amortized cost balances.
(2) Nonperforming loans are included in the respective average loan balances. Income on such nonperforming loans is recognized on a cash basis.
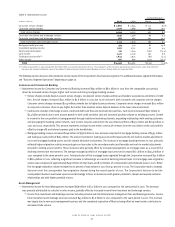
(3) Interest income includes taxable-equivalent basis adjustments of $343, $322 and $215 in 2001, 2000 and 1999, respectively. Interest income also includes the impact of risk management
interest rate contracts, which increased (decreased) interest income on the underlying assets $978, $(48) and $306 in 2001, 2000 and 1999, respectively. These amounts were substantially
offset by corresponding decreases or increases in the income earned on the underlying assets. For further information on interest rate contracts, see “Asset and Liability Management Activities”
beginning on page 67.
(4) Primarily consists of time deposits in denominations of $100,000 or more.
(5) Long-term debt includes trust preferred securities.
(6) Interest expense includes the impact of risk management interest rate contracts, which (increased) decreased interest expense on the underlying liabilities $63, $(36) and $116 in 2001, 2000,
and 1999, respectively. These amounts were substantially offset by corresponding decreases or increases in the interest paid on the underlying liabilities. For further information on interest
rate contracts, see “Asset and Liability Management Activities” beginning on page 67.