Bank of America 2001 Annual Report Download - page 60
Download and view the complete annual report
Please find page 60 of the 2001 Bank of America annual report below. You can navigate through the pages in the report by either clicking on the pages listed below, or by using the keyword search tool below to find specific information within the annual report.-
 1
1 -
2
-
3
-
4
-
5
-
6
-
7
-
8
-
9
-
10
-
11
-
12
-
13
-
14
-
15
-
16
-
17
-
18
-
19
-
20
-
21
-
22
-
23
-
24
-
25
-
26
-
27
-
28
-
29
-
30
-
31
-
32
-
33
-
34
-
35
-
36
-
37
-
38
-
39
-
40
-
41
-
42
-
43
-
44
-
45
-
46
-
47
-
48
-
49
-
 50
50 -
 51
51 -
 52
52 -
 53
53 -
 54
54 -
 55
55 -
 56
56 -
 57
57 -
 58
58 -
 59
59 -
 60
60 -
 61
61 -
 62
62 -
 63
63 -
 64
64 -
 65
65 -
 66
66 -
 67
67 -
 68
68 -
 69
69 -
 70
70 -
71
-
72
-
73
-
74
-
75
-
76
-
77
-
78
-
79
-
80
-
81
-
82
-
83
-
84
-
85
-
86
-
87
-
88
-
89
-
90
-
91
-
92
-
93
-
94
-
95
-
96
-
97
-
98
-
99
-
100
-
101
-
102
-
103
-
104
-
105
-
106
-
107
-
108
-
109
-
110
-
111
-
112
-
113
-
114
-
115
-
116
-
117
-
118
-
119
-
120
-
121
-
122
-
123
-
124
 |
 |

BANK OF AMERICA 2001 ANNUAL REPORT
58
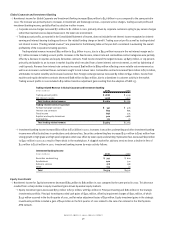
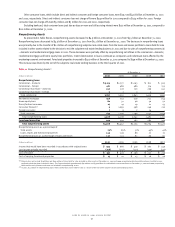
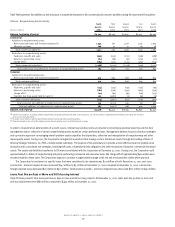
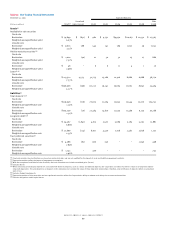
Table Twelve presents the additions to and reductions in nonperforming assets in the commercial and consumer portfolios during the most recent five quarters.
Table 12 Nonperforming Assets Activity
Fourth Third Second First Fourth
Quarter Quarter Quarter Quarter Quarter
(Dollars in millions)
2001 2001 2001 2001 2000
Balance, beginning of period $4,523 $6,195 $5,897 $5,457 $4,403
Commercial
Additions to nonperforming assets:
New nonaccrual loans and foreclosed properties 1,345 761 1,376 1,315 1,954
Advances on loans 106 32 33 26 28
Total commercial additions 1,451 793 1,409 1,341 1,982
Reductions in nonperforming assets:
Paydowns, payoffs and sales (300) (635) (732) (398) (288)
Returns to performing status (82) (86) (19) (126) (73)
Charge-offs(1) (784) (513) (525) (467) (774)
Total commercial reductions (1,166) (1,234) (1,276) (991) (1,135)
Total commercial net additions to (reductions in) nonperforming assets 285 (441) 133 350 847
Consumer
Additions to nonperforming assets:
New nonaccrual loans and foreclosed properties 374 694 836 819 834
Total consumer additions 374 694 836 819 834
Reductions in nonperforming assets:
Paydowns, payoffs and sales (174) (413) (159) (135) (95)
Returns to performing status (181) (256) (440) (483) (391)
Charge-offs(1) (22) (69) (69) (101) (135)
Transfers (to) from assets held for sale(2,3) 103 (1,187) (3) (10) (6)
Total consumer reductions (274) (1,925) (671) (729) (627)
Total consumer net additions to (reductions in) nonperforming assets 100 (1,231) 165 90 207
Total net additions to (reductions in) nonperforming assets 385 (1,672) 298 440 1,054
Balance, end of period $4,908 $4,523 $6,195 $5,897 $5,457
(1) Certain loan products, including commercial bankcard, consumer bankcard and other unsecured loans, are not classified as nonperforming; therefore, the charge-offs on these
loans are not included above.
(2) Includes assets held for sale that were foreclosed and transferred to foreclosed properties.
(3) Primarily related to the exit of the subprime real estate lending business in the third quarter of 2001.
In order to respond when deterioration of a credit occurs, internal loan workout units are devoted to providing specialized expertise and full-time
management and/or collection of certain nonperforming assets as well as certain performing loans. Management believes focused collection strategies
and a proactive approach to managing overall problem assets expedites the disposition, collection and renegotiation of nonperforming and other
lower-quality assets. During 2001, the Corporation realigned its operations that manage certain distressed assets through the funding of Banc of
America Strategic Solutions, Inc. (SSI), a wholly-owned subsidiary. The purpose of this subsidiary is to provide a more effective means of problem asset
resolution and to coordinate exit strategies, including bulk sales, collateralized debt obligations and other resolutions of domestic commercial distressed
assets. The assets and liabilities transferred to SSI were consolidated with the Corporation at December 31, 2001. During 2001, the Corporation sold
approximately $2.1 billion of nonperforming and poorly performing commercial and consumer loans. Net charge-offs of approximately $400 million were
recorded related to these sales. The Corporation expects to continue to aggressively manage credit risk and to exit problem credits where practical.
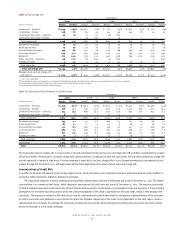
The Corporation’s investment in specific loans that were considered to be impaired was $3.9 billion at both December 31, 2001 and 2000.
Commercial – domestic impaired loans increased $247 million to $3.1 billion at December 31, 2001 compared to December 31, 2000. Commercial –
foreign impaired loans decreased $20 million to $501 million. Commercial real estate – domestic impaired loans decreased $172 million to $240 million.
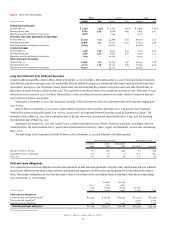
Loans Past Due 90 Days or More and Still Accruing Interest
Table Thirteen presents total loans past due 90 days or more and still accruing interest. At December 31, 2001, loans past due 90 days or more and
still accruing interest were $680 million compared to $495 million at December 31, 2000.