Bank of America 2001 Annual Report Download - page 80
Download and view the complete annual report
Please find page 80 of the 2001 Bank of America annual report below. You can navigate through the pages in the report by either clicking on the pages listed below, or by using the keyword search tool below to find specific information within the annual report.-
 1
1 -
2
-
3
-
4
-
5
-
6
-
7
-
8
-
9
-
10
-
11
-
12
-
13
-
14
-
15
-
16
-
17
-
18
-
19
-
20
-
21
-
22
-
23
-
24
-
25
-
26
-
27
-
28
-
29
-
30
-
31
-
32
-
33
-
34
-
35
-
36
-
37
-
38
-
39
-
40
-
41
-
42
-
43
-
44
-
45
-
46
-
47
-
48
-
49
-
50
-
51
-
52
-
53
-
54
-
55
-
56
-
57
-
58
-
59
-
60
-
61
-
62
-
63
-
64
-
65
-
66
-
67
-
68
-
69
-
 70
70 -
 71
71 -
 72
72 -
 73
73 -
 74
74 -
 75
75 -
 76
76 -
 77
77 -
 78
78 -
 79
79 -
 80
80 -
 81
81 -
 82
82 -
 83
83 -
 84
84 -
 85
85 -
 86
86 -
 87
87 -
 88
88 -
 89
89 -
 90
90 -
91
-
92
-
93
-
94
-
95
-
96
-
97
-
98
-
99
-
100
-
101
-
102
-
103
-
104
-
105
-
106
-
107
-
108
-
109
-
110
-
111
-
112
-
113
-
114
-
115
-
116
-
117
-
118
-
119
-
120
-
121
-
122
-
123
-
124
 |
 |

BANK OF AMERICA 2001 ANNUAL REPORT
78
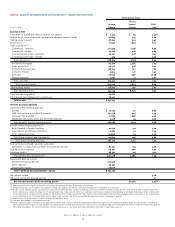
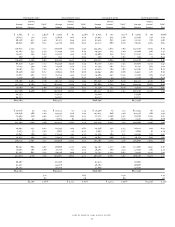
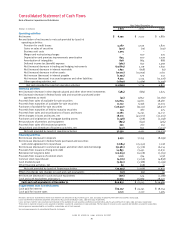
Consolidated Statement of Income
Bank of America Corporation and Subsidiaries
Year Ended December 31
(Dollars in millions, except per share information)
2001 2000 1999
Interest income
Interest and fees on loans and leases $ 27,166 $ 31,818 $ 27,588
Interest and dividends on securities 3,706 5,006 4,708
Federal funds sold and securities purchased under agreements to resell 1,414 2,354 1,666
Trading account assets 3,623 2,725 2,077
Other interest income 2,384 1,262 1,174
Total interest income 38,293 43,165 37,213
Interest expense
Deposits 8,886 11,007 9,002
Short-term borrowings 4,167 7,957 5,826
Trading account liabilities 1,155 892 658
Long-term debt 3,795 4,960 3,600
Total interest expense 18,003 24,816 19,086
Net interest income 20,290 18,349 18,127
Noninterest income
Consumer service charges 2,866 2,654 2,550
Corporate service charges 2,078 1,889 1,790
Total service charges 4,944 4,543 4,340
Consumer investment and brokerage services 1,546 1,466 1,334
Corporate investment and brokerage services 566 463 414
Total investment and brokerage services 2,112 1,929 1,748
Mortgage banking income 593 512 648
Investment banking income 1,579 1,512 1,411
Equity investment gains 291 1,054 833
Card income 2,421 2,229 2,006
Trading account profits(1) 1,842 1,923 1,605
Other income 566 880 1,588
Total noninterest income 14,348 14,582 14,179
Total revenue 34,638 32,931 32,306
Provision for credit losses 4,287 2,535 1,820
Gains on sales of securities 475 25 240
Noninterest expense
Personnel 9,829 9,400 9,308
Occupancy 1,774 1,682 1,627
Equipment 1,115 1,173 1,346
Marketing 682 621 537
Professional fees 564 452 630
Amortization of intangibles 878 864 888
Data processing 776 667 763
Telecommunications 484 527 549
Other general operating 2,687 2,114 1,820
General administrative and other 615 583 518
Business exit costs 1,305 ––
Merger and restructuring charges –550 525
Total noninterest expense 20,709 18,633 18,511
Income before income taxes 10,117 11,788 12,215
Income tax expense 3,325 4,271 4,333
Net income $ 6,792 $ 7,517 $ 7,882
Net income available to common shareholders $ 6,787 $ 7,511 $ 7,876
Per share information
Earnings per common share $ 4.26 $ 4.56 $ 4.56
Diluted earnings per common share $ 4.18 $ 4.52 $ 4.48
Dividends per common share $2.28 $ 2.06 $ 1.85
Average common shares issued and outstanding (in thousands) 1,594,957 1,646,398 1,726,006
(1) Trading account profits for 2001 included the $83 million transition adjustment loss resulting from the adoption of Statement of Financial Accounting Standards No. 133, “Accounting for
Derivative Instruments and Hedging Activities,” (SFAS 133) on January 1, 2001.
See accompanying notes to consolidated financial statements.