Bank of America 2001 Annual Report Download - page 115
Download and view the complete annual report
Please find page 115 of the 2001 Bank of America annual report below. You can navigate through the pages in the report by either clicking on the pages listed below, or by using the keyword search tool below to find specific information within the annual report.-
 1
1 -
2
-
3
-
4
-
5
-
6
-
7
-
8
-
9
-
10
-
11
-
12
-
13
-
14
-
15
-
16
-
17
-
18
-
19
-
20
-
21
-
22
-
23
-
24
-
25
-
26
-
27
-
28
-
29
-
30
-
31
-
32
-
33
-
34
-
35
-
36
-
37
-
38
-
39
-
40
-
41
-
42
-
43
-
44
-
45
-
46
-
47
-
48
-
49
-
50
-
51
-
52
-
53
-
54
-
55
-
56
-
57
-
58
-
59
-
60
-
61
-
62
-
63
-
64
-
65
-
66
-
67
-
68
-
69
-
70
-
71
-
72
-
73
-
74
-
75
-
76
-
77
-
78
-
79
-
80
-
81
-
82
-
83
-
84
-
85
-
86
-
87
-
88
-
89
-
90
-
91
-
92
-
93
-
94
-
95
-
96
-
97
-
98
-
99
-
100
-
101
-
102
-
103
-
104
-
 105
105 -
 106
106 -
 107
107 -
 108
108 -
 109
109 -
 110
110 -
 111
111 -
 112
112 -
 113
113 -
 114
114 -
 115
115 -
 116
116 -
 117
117 -
 118
118 -
 119
119 -
 120
120 -
 121
121 -
 122
122 -
 123
123 -
 124
124
 |
 |

BANK OF AMERICA 2001 ANNUAL REPORT
113
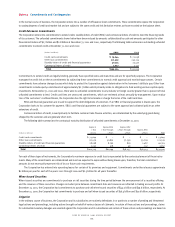
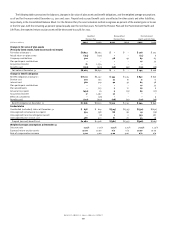
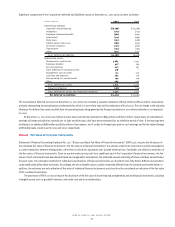
Significant components of the Corporation’s deferred tax (liabilities) assets at December 31, 2001 and 2000 were as follows:
(Dollars in millions)
2001 2000
Deferred tax liabilities:
Equipment lease financing $(6,788) $ (6,268)
Intangibles (767) (733)
Employee retirement benefits (560) (403)
Investments (551) (494)
State taxes (431) (438)
Deferred gains and losses (285) (295)
Securities valuation (231) (400)
Depreciation (144) (145)
Other (323) (232)
Gross deferred tax liabilities (10,080) (9,408)
Deferred tax assets:
Allowance for credit losses 3,085 2,751
Employee benefits 497 344
Accrued expenses 430 341
Basis difference in subsidiary stock 418 –
Available-for-sale securities 311 330
Loan fees and expenses 282 116
Net operating loss carryforwards 149 130
Other 463 425
Gross deferred tax assets 5,635 4,437
Valuation allowance (136) (114)
Gross deferred tax assets, net of valuation allowance 5,499 4,323
Net deferred tax liabilities $ (4,581) $ (5,085)
The Corporation’s deferred tax assets at December 31, 2001 and 2000 included a valuation allowance of $136 million and $114 million, respectively,
primarily representing net operating loss carryforwards for which it is more likely than not that realization will not occur. The net change in the valuation
allowance for deferred tax assets resulted from net operating losses being generated by foreign subsidiaries in 2001 where realization is not expected
to occur.
At December 31, 2001 and 2000, federal income taxes had not been provided on $859 million and $762 million, respectively, of undistributed
earnings of foreign subsidiaries, earned prior to 1987 and after 1997, that have been reinvested for an indefinite period of time. If the earnings were
distributed, an additional $188 million and $163 million of tax expense, net of credits for foreign taxes paid on such earnings and for the related foreign
withholding taxes, would result in 2001 and 2000, respectively.
Note 18 Fair Value of Financial Instruments
Statement of Financial Accounting Standards No. 107, “Disclosures About Fair Value of Financial Instruments” (SFAS 107), requires the disclosure of
the estimated fair value of financial instruments. The fair value of a financial instrument is the amount at which the instrument could be exchanged in
a current transaction between willing parties, other than in a forced or liquidation sale. Quoted market prices, if available, are utilized as estimates of
the fair values of financial instruments. Since no quoted market prices exist for a significant part of the Corporation’s financial instruments, the fair
values of such instruments have been derived based on management’s assumptions, the estimated amount and timing of future cash flows and estimated
discount rates. The estimation methods for individual classifications of financial instruments are described more fully below. Different assumptions
could significantly affect these estimates. Accordingly, the net realizable values could be materially different from the estimates presented below. In
addition, the estimates are only indicative of the value of individual financial instruments and should not be considered an indication of the fair value
of the combined Corporation.
The provisions of SFAS 107 do not require the disclosure of the fair value of lease financing arrangements and nonfinancial instruments, including
intangible assets such as goodwill, franchise, and credit card and trust relationships.