Bank of America 2001 Annual Report Download - page 48
Download and view the complete annual report
Please find page 48 of the 2001 Bank of America annual report below. You can navigate through the pages in the report by either clicking on the pages listed below, or by using the keyword search tool below to find specific information within the annual report.-
 1
1 -
2
-
3
-
4
-
5
-
6
-
7
-
8
-
9
-
10
-
11
-
12
-
13
-
14
-
15
-
16
-
17
-
18
-
19
-
20
-
21
-
22
-
23
-
24
-
25
-
26
-
27
-
28
-
29
-
30
-
31
-
32
-
33
-
34
-
35
-
36
-
37
-
 38
38 -
 39
39 -
 40
40 -
 41
41 -
 42
42 -
 43
43 -
 44
44 -
 45
45 -
 46
46 -
 47
47 -
 48
48 -
 49
49 -
 50
50 -
 51
51 -
 52
52 -
 53
53 -
 54
54 -
 55
55 -
 56
56 -
 57
57 -
 58
58 -
59
-
60
-
61
-
62
-
63
-
64
-
65
-
66
-
67
-
68
-
69
-
70
-
71
-
72
-
73
-
74
-
75
-
76
-
77
-
78
-
79
-
80
-
81
-
82
-
83
-
84
-
85
-
86
-
87
-
88
-
89
-
90
-
91
-
92
-
93
-
94
-
95
-
96
-
97
-
98
-
99
-
100
-
101
-
102
-
103
-
104
-
105
-
106
-
107
-
108
-
109
-
110
-
111
-
112
-
113
-
114
-
115
-
116
-
117
-
118
-
119
-
120
-
121
-
122
-
123
-
124
 |
 |

BANK OF AMERICA 2001 ANNUAL REPORT
46
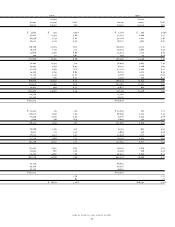
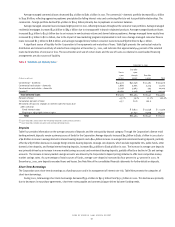
Table 5 Analysis of Changes in Net Interest Income – Taxable-Equivalent Basis
From 2000 to 2001 From 1999 to 2000
Due to Change in(1) Net Due to Change in(1) Net
(Dollars in millions) Volume Rate Change Volume Rate Change
Increase (decrease) in interest income
Time deposits placed and other short-term investments $ 129 $ (147) $ (18) $(23) $ 64 $ 41
Federal funds sold and securities purchased under agreements to resell (383) (557) (940) 506 182 688
Trading account assets 982 (80) 902 521 128 649
Securities (1,446) 96 (1,350) 242 58 300
Loans and leases:
Commercial – domestic (1,179) (967) (2,146) 719 1,194 1,913
Commercial – foreign (204) (343) (547) (3) 220 217
Commercial real estate – domestic (114) (485) (599) 28 156 184
Commercial real estate – foreign 4 (11) (7) 2–2
Total commercial (3,299) 2,316
Residential mortgage (717) (117) (834) 873 214 1,087
Home equity lines 227 (350) (123) 262 218 480
Direct/Indirect consumer (161) (260) (421) (64) 41 (23)
Consumer finance (518) 41 (477) 504 (14) 490
Bankcard 768 (130) 638 57 50 107
Foreign consumer – (68) (68) (106) (15) (121)
Total consumer (1,285) 2,020
Total loans and leases (4,584) 4,336
Other earning assets 1,315 (176) 1,139 (80) 125 45
Total interest income (4,851) 6,059
Increase (decrease) in interest expense
Domestic interest-bearing deposits:
Savings (43) (58) (101) (2) 16 14
NOW and money market deposit accounts 430 (873) (443) 34 533 567
Consumer CDs and IRAs (162) (190) (352) 166 505 671
Negotiable CDs, public funds and other time deposits (112) (79) (191) 54 66 120
Total domestic interest-bearing deposits (1,087) 1,372
Foreign interest-bearing deposits:
Banks located in foreign countries 276 (353) (77) 122 206 328
Governments and official institutions (305) (56) (361) 53 60 113
Time, savings and other (168) (428) (596) 3 189 192
Total foreign interest-bearing deposits (1,034) 633
Total interest-bearing deposits (2,121) 2,005
Federal funds purchased, securities sold under agreements
to repurchase and other short-term borrowings (2,362) (1,428) (3,790) 775 1,356 2,131
Trading account liabilities 230 33 263 358 (124) 234
Long-term debt (45) (1,120) (1,165) 793 567 1,360
Total interest expense (6,813) 5,730
Net increase in net interest income $ 1,962 $329
(1) The changes for each category of interest income and expense are divided between the portion of change attributable to the variance in volume or rate for that category. The change in
rate/volume variance has been allocated to the rate variance.
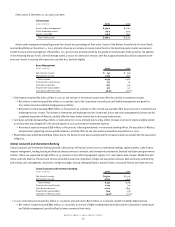
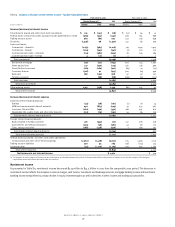
Noninterest Income
As presented in Table Six, noninterest income decreased $234 million to $14.3 billion in 2001 from the comparable 2000 period. The decrease in
noninterest income reflects the increases in service charges, card income, investment and brokerage services, mortgage banking income and investment
banking income being offset by a sharp decline in equity investment gains as well as declines in other income and trading account profits.