Bank of America 2001 Annual Report Download - page 39
Download and view the complete annual report
Please find page 39 of the 2001 Bank of America annual report below. You can navigate through the pages in the report by either clicking on the pages listed below, or by using the keyword search tool below to find specific information within the annual report.-
 1
1 -
2
-
3
-
4
-
5
-
6
-
7
-
8
-
9
-
10
-
11
-
12
-
13
-
14
-
15
-
16
-
17
-
18
-
19
-
20
-
21
-
22
-
23
-
24
-
25
-
26
-
27
-
28
-
 29
29 -
 30
30 -
 31
31 -
 32
32 -
 33
33 -
 34
34 -
 35
35 -
 36
36 -
 37
37 -
 38
38 -
 39
39 -
 40
40 -
 41
41 -
 42
42 -
 43
43 -
 44
44 -
 45
45 -
 46
46 -
 47
47 -
 48
48 -
 49
49 -
50
-
51
-
52
-
53
-
54
-
55
-
56
-
57
-
58
-
59
-
60
-
61
-
62
-
63
-
64
-
65
-
66
-
67
-
68
-
69
-
70
-
71
-
72
-
73
-
74
-
75
-
76
-
77
-
78
-
79
-
80
-
81
-
82
-
83
-
84
-
85
-
86
-
87
-
88
-
89
-
90
-
91
-
92
-
93
-
94
-
95
-
96
-
97
-
98
-
99
-
100
-
101
-
102
-
103
-
104
-
105
-
106
-
107
-
108
-
109
-
110
-
111
-
112
-
113
-
114
-
115
-
116
-
117
-
118
-
119
-
120
-
121
-
122
-
123
-
124
 |
 |

BANK OF AMERICA 2001 ANNUAL REPORT
37
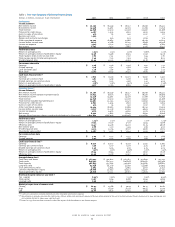
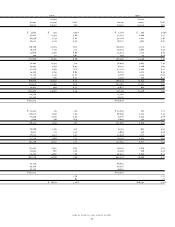
Table 2 Business Segment Summary
For the Year Ended December 31
Consumer and Global Corporate and
Commercial Banking
(1)
Asset Management
(1)
Investment Banking
(1)
Equity Investments
(1)
(Dollars in millions)
2001 2000 2001 2000 2001 2000 2001 2000
Net interest income(2) $ 13,364 $ 12,620 $741$ 666 $4,592 $3,725 $ (151) $(139)
Noninterest income(3) 8,008 7,356 1,733 1,801 4,639 4,444 183 1,007
Total revenue 21,372 19,976 2,474 2,467 9,231 8,169 32 868
Provision for credit losses 1,802 1,111 121 47 1,275 751 84
Net income 4,842 4,551 521 589 1,879 1,759 (94) 461
Cash basis earnings 5,479 5,200 578 619 2,022 1,897 (84) 472
Shareholder value added 3,165 2,830 312 421 644 336 (363) 241
Net interest yield 5.06% 4.93% 2.91% 2.80% 2.40% 1.97% n/m n/m
Return on average equity 25.1 23.0 23.6 35.7 16.4 13.5 (4.0)% 24.0%
Cash basis return on equity 28.4 26.3 26.1 37.5 17.6 14.6 (3.6) 24.6
Efficiency ratio 54.7 56.7 62.2 59.3 55.9 59.1 n/m 12.9
Cash basis efficiency ratio 51.7 53.5 59.9 58.0 54.3 57.4 n/m 11.7
Average:
Total loans and leases $181,900 $ 173,870 $ 24,381 $ 22,729 $80,739 $ 94,391 $476 $436
Total deposits 266,049 256,805 11,897 11,338 66,983 68,364 13 14
Total assets 290,388 282,014 26,767 24,724 230,755 227,417 6,509 5,453
Year end:
Total loans and leases $185,429 $ 179,014 $ 24,692 $ 24,273 $ 66,556 $93,510 $ 433 $ 497
Total deposits 280,965 264,196 12,208 12,337 66,532 68,138 –35
Total assets 304,874 287,013 26,810 27,140 194,146 206,820 6,230 6,691
n/m = not meaningful
(1) There were no material intersegment revenues among the segments.
(2) Net interest income is presented on a taxable-equivalent basis.
(3) Noninterest income included the $83 million SFAS 133 transition adjustment net loss which was included in trading account profits in 2001. The components of the transition adjustment by
segment were a gain of $4 million for Consumer and Commercial Banking, a gain of $19 million for Global Corporate and Investment Banking and a loss of $106 million for Corporate Other
(not included in the table above).
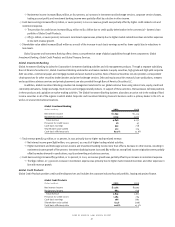
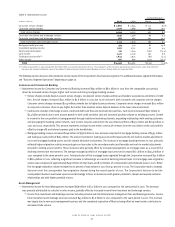
Consumer and Commercial Banking
Consumer and Commercial Banking provides a wide array of products and services to individuals, small businesses and middle market companies through
multiple delivery channels.
The results for 2001 reflect the Corporation’s continued focus on card services as a growth area. End of period managed consumer card outstandings
increased 19 percent from 2000, primarily driven by the leveraging of the Corporation’s franchise to open new accounts with existing customers, the
results of card marketing programs and efforts aimed at increasing customer satisfaction. In 2001, merchant processing volume increased 12 percent,
and total card services purchase volume increased 12 percent, primarily driven by an 18 percent increase in debit card purchase volume. The increase
in debit card purchase volume was a result of increased customer penetration and activation rates, partially offset by a drop in purchase volume growth
rates following the events of September 11, 2001.
In the second quarter of 2001, the Corporation’s commercial real estate banking business was moved from Global Corporate and Investment
Banking to Consumer and Commercial Banking. The credit and client management process and customer base of the business are better aligned with
those of Consumer and Commercial Banking.
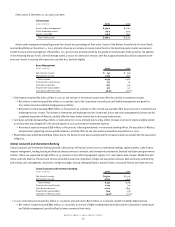
Consumer and Commercial Banking
(Dollars in millions)
2001 2000
Net interest income $13,364 $12,620
Noninterest income 8,008 7,356
Total revenue 21,372 19,976
Provision for credit losses 1,802 1,111
Cash basis earnings 5,479 5,200
Shareholder value added 3,165 2,830
Cash basis efficiency ratio 51.7% 53.5%
>Total revenue increased $1.4 billion, or seven percent, in 2001 compared to 2000.
>
Net interest income increased $744 million, or six percent, due to a favorable shift in loan mix, overall loan and deposit growth and the
Corporation’s overall asset and liability management. This increase was partially offset by the impact of the money market deposit pricing
initiative as the Corporation offered more competitive money market savings rates.
>
Noninterest income increased $652 million, or nine percent, driven by nine percent increases in card income and service charges and strong
mortgage banking revenue.