Bank of America 2001 Annual Report Download - page 63
Download and view the complete annual report
Please find page 63 of the 2001 Bank of America annual report below. You can navigate through the pages in the report by either clicking on the pages listed below, or by using the keyword search tool below to find specific information within the annual report.-
 1
1 -
2
-
3
-
4
-
5
-
6
-
7
-
8
-
9
-
10
-
11
-
12
-
13
-
14
-
15
-
16
-
17
-
18
-
19
-
20
-
21
-
22
-
23
-
24
-
25
-
26
-
27
-
28
-
29
-
30
-
31
-
32
-
33
-
34
-
35
-
36
-
37
-
38
-
39
-
40
-
41
-
42
-
43
-
44
-
45
-
46
-
47
-
48
-
49
-
50
-
51
-
52
-
 53
53 -
 54
54 -
 55
55 -
 56
56 -
 57
57 -
 58
58 -
 59
59 -
 60
60 -
 61
61 -
 62
62 -
 63
63 -
 64
64 -
 65
65 -
 66
66 -
 67
67 -
 68
68 -
 69
69 -
 70
70 -
 71
71 -
 72
72 -
 73
73 -
74
-
75
-
76
-
77
-
78
-
79
-
80
-
81
-
82
-
83
-
84
-
85
-
86
-
87
-
88
-
89
-
90
-
91
-
92
-
93
-
94
-
95
-
96
-
97
-
98
-
99
-
100
-
101
-
102
-
103
-
104
-
105
-
106
-
107
-
108
-
109
-
110
-
111
-
112
-
113
-
114
-
115
-
116
-
117
-
118
-
119
-
120
-
121
-
122
-
123
-
124
 |
 |

BANK OF AMERICA 2001 ANNUAL REPORT
61
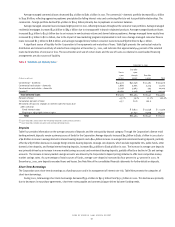
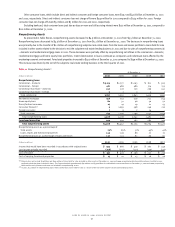
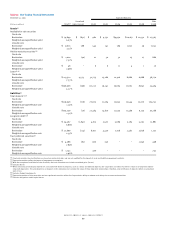
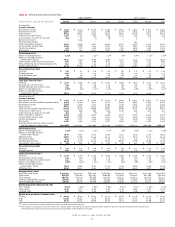
Table 15 Net Charge-offs
December 31
2001 2000 1999 1998 1997
(Dollars in millions)
Amount Percent
(1)
Amount Percent
(1)
Amount Percent
(1)
Amount Percent
(1)
Amount Percent
(1)
Commercial – domestic $1,949 1.46% $1,287 .87% $ 711 .51% $ 617 .47% $ 102 .09%
Commercial – foreign 208 .78 86 .29 144 .49 242 .78 29 .10
Commercial real estate – domestic 39 .16 13 .05 (6) n/m – – – –
Commercial real estate – foreign –– (2) n/m 1 .39 – – – –
Total commercial 2,196 1.19 1,384 .68 850 .44 859 .45 131 .07
Residential mortgage 26 .03 27 .03 28 .04 29 .04 45 .06
Home equity lines 19 .09 20 .10 12 .07 17 .11 27 .18
Direct/Indirect consumer 349 .88 324 .78 370 .88 405 1.01 436 1.11
Consumer finance(2) 929 5.01 266 1.09 229 1.22 383 2.67 271 1.96
Bankcard 672 4.04 338 3.29 495 5.08 764 6.03 919 5.90
Other consumer – domestic 48 n/m 38 n/m (1) n/m – – 12 n/m
Foreign consumer 5.22 3 .13 17 .52 10 .31 11 .32
Total consumer 2,048 1.14 1,016 .54 1,150 .68 1,608 1.02 1,721 1.03
Total net charge-offs $4,244 1.16% $2,400 .61% $2,000 .55% $2,467 .71% $1,852 .54%
Managed bankcard net charge-offs
and ratios(3) $1,174 4.76% $ 944 4.66% $1,077 5.57% $ 1,284 6.27% $ 1,254 6.19%
n/m = not meaningful
(1) Percentage amounts are calculated as net charge-offs divided by average outstanding loans and leases or managed loans for each loan category.
(2) Includes $635 million related to the exit of the subprime real estate lending business in 2001.
(3) Includes both on-balance sheet and securitized loans.
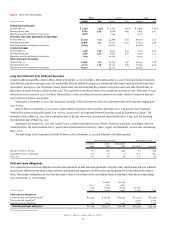
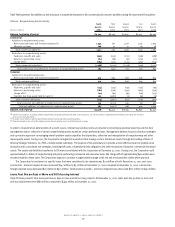
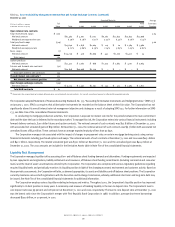
Table 16 Allocation of the Allowance for Credit Losses
December 31
2001 2000 1999 1998 1997
(Dollars in millions)
Amount Percent Amount Percent Amount Percent Amount Percent Amount Percent
Commercial – domestic $1,974 28.7% $1,993 29.1% $ 1,875 27.4% $ 1,540 21.6% $1,580 23.4%
Commercial – foreign 766 11.1 796 11.6 930 13.6 1,327 18.6 1,013 14.9
Commercial real estate – domestic 924 13.5 989 14.5 927 13.6 925 13.0 847 12.5
Commercial real estate – foreign 8.1 7.1 11.2 – – – –
Total commercial 3,672 53.4 3,785 55.3 3,743 54.8 3,792 53.2 3,440 50.8
Residential mortgage 145 2.1 151 2.2 160 2.3 137 1.9 181 2.7
Home equity lines 83 1.2 771.1 60.9 46.6 841.2
Direct/Indirect consumer 411 6.0 384 5.6 416 6.1 527 7.5 608 9.0
Consumer finance 389 5.7 658 9.7 651 9.5 658 9.2 785 11.6
Bankcard 821 11.9 549 8.0 348 5.1 501 7.0 790 11.7
Foreign consumer 10 .1 11 .2 11 .2 26 .4 23 .3
Total consumer 1,859 27.0 1,830 26.8 1,646 24.1 1,895 26.6 2,471 36.5
Unassigned 1,344 19.6 1,223 17.9 1,439 21.1 1,435 20.2 867 12.7
Total $6,875 100.0% $6,838 100.0% $6,828 100.0% $7,122 100.0% $6,778 100.0%
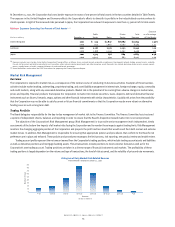
The Corporation expects charge-offs in 2002 to meet or exceed annualized fourth quarter 2001 net charge-offs of $3.9 billion, excluding Enron charge-
offs of $210 million. An increase in consumer charge-offs, mainly bankcard, is expected to drive the increase for the year while commercial charge-offs
are also expected to remain at high levels. Provision expense is expected to track net charge-offs in 2002. Nonperforming assets are expected to rise
at least through the first half of 2002, although levels will fluctuate depending on the level of asset sales and charge-offs.
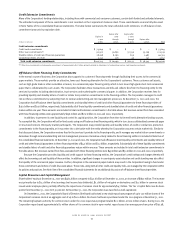
Concentrations of Credit Risk
In an effort to minimize the adverse impact of any single event or set of occurrences, the Corporation strives to maintain a diverse credit portfolio as
outlined in Tables Seventeen, Eighteen, Nineteen and Twenty.
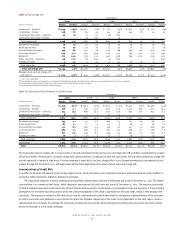
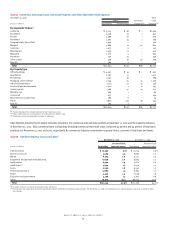
The Corporation maintains a diverse commercial loan portfolio, representing 50 percent of total loans and leases at December 31, 2001. The largest
concentration is in commercial real estate, which represents seven percent of total loans and leases at December 31, 2001. The exposures presented
in Table Seventeen represent credit extensions for real estate-related purposes to borrowers or counterparties who are primarily in the real estate
development or investment business and for which the ultimate repayment of the credit is dependent on the sale, lease, rental or refinancing of the
real estate. The exposures included in the table do not include credit extensions which were made on the general creditworthiness of the borrower,
for which real estate was obtained as security and for which the ultimate repayment of the credit is not dependent on the sale, lease, rental or
refinancing of the real estate. Accordingly, the exposures presented do not include commercial loans secured by owner-occupied real estate, except
where the borrower is a real estate developer.