Bank of America 2001 Annual Report Download - page 43
Download and view the complete annual report
Please find page 43 of the 2001 Bank of America annual report below. You can navigate through the pages in the report by either clicking on the pages listed below, or by using the keyword search tool below to find specific information within the annual report.-
 1
1 -
2
-
3
-
4
-
5
-
6
-
7
-
8
-
9
-
10
-
11
-
12
-
13
-
14
-
15
-
16
-
17
-
18
-
19
-
20
-
21
-
22
-
23
-
24
-
25
-
26
-
27
-
28
-
29
-
30
-
31
-
32
-
 33
33 -
 34
34 -
 35
35 -
 36
36 -
 37
37 -
 38
38 -
 39
39 -
 40
40 -
 41
41 -
 42
42 -
 43
43 -
 44
44 -
 45
45 -
 46
46 -
 47
47 -
 48
48 -
 49
49 -
 50
50 -
 51
51 -
 52
52 -
 53
53 -
54
-
55
-
56
-
57
-
58
-
59
-
60
-
61
-
62
-
63
-
64
-
65
-
66
-
67
-
68
-
69
-
70
-
71
-
72
-
73
-
74
-
75
-
76
-
77
-
78
-
79
-
80
-
81
-
82
-
83
-
84
-
85
-
86
-
87
-
88
-
89
-
90
-
91
-
92
-
93
-
94
-
95
-
96
-
97
-
98
-
99
-
100
-
101
-
102
-
103
-
104
-
105
-
106
-
107
-
108
-
109
-
110
-
111
-
112
-
113
-
114
-
115
-
116
-
117
-
118
-
119
-
120
-
121
-
122
-
123
-
124
 |
 |

BANK OF AMERICA 2001 ANNUAL REPORT
41
>
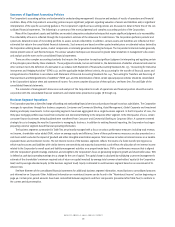
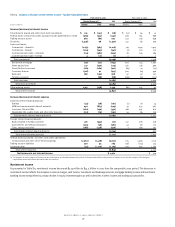
Noninterest income increased $195 million, or four percent, as increases in investment and brokerage services, corporate service charges,
trading account profits and investment banking income were partially offset by a decline in other income.
>Cash basis earnings increased $125 million, or seven percent, in 2001 as revenue growth was partially offset by higher credit-related costs and
noninterest expense.
>
The provision for credit losses increased $524 million to $1.3 billion due to credit quality deterioration in the commercial – domestic loan
portfolio of Global Credit Products.
>
A $331 million, or seven percent, increase in noninterest expense was primarily due to higher market-related incentives and other expenses
in line with revenue growth.
>Shareholder value added increased $308 million as a result of the increase in cash basis earnings as well as lower capital due to reductions in
loan levels.
Global Corporate and Investment Banking offers clients a comprehensive range of global capabilities through three components: Global
Investment Banking, Global Credit Products and Global Treasury Services.
Global Investment Banking
Global Investment Banking includes the Corporation’s investment banking activities and risk management products. Through a separate subsidiary,
Banc of America Securities LLC, Global Investment Banking underwrites and makes markets in equity securities, high-grade and high-yield corporate
debt securities, commercial paper, and mortgage-backed and asset-backed securities. Banc of America Securities LLC also provides correspondent
clearing services for other securities broker/dealers and prime-brokerage services. Debt and equity securities research, loan syndications, mergers
and acquisitions advisory services and private placements are also provided through Banc of America Securities LLC.
In addition, Global Investment Banking provides risk management solutions for our global customer base using interest rate, equity, credit and
commodity derivatives, foreign exchange, fixed income and mortgage-related products. In support of these activities, the businesses will take positions
in these products and capitalize on market-making activities. The Global Investment Banking business also takes an active role in the trading of fixed
income securities in all of the regions in which Global Corporate and Investment Banking transacts business and is a primary dealer in the U.S. as
well as in several international locations.
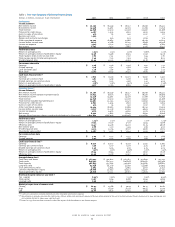
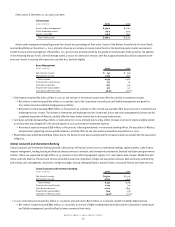
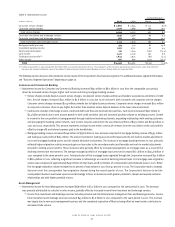
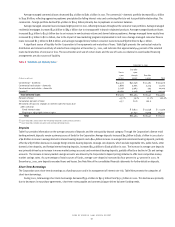
Global Investment Banking
(Dollars in millions)
2001 2000
Net interest income $ 1,693 $1,125
Noninterest income 3,153 3,007
Total revenue 4,846 4,132
Provision for credit losses 26 43
Cash basis earnings 932 778
Shareholder value added 512 374
Cash basis efficiency ratio 69.9% 72.6%
>Total revenue grew $714 million, or 17 percent, in 2001 primarily due to higher trading-related revenue.
>
Net interest income grew $568 million, or 51 percent, as a result of higher trading-related activities.
>
Higher investment and brokerage services income and investment banking income more than offset a decrease in other income, resulting in
noninterest income growth of five percent. Investment banking income increased $67 million as strong fixed income originations were partially
offset by weaker demand in syndications, equity underwriting and advisory services.
>Cash basis earnings increased $154 million, or 20 percent, in 2001, as revenue growth was partially offset by an increase in noninterest expense.
>
The $390 million, or 13 percent, increase in noninterest expense was primarily due to higher market-related incentives and other expenses in
line with revenue growth.
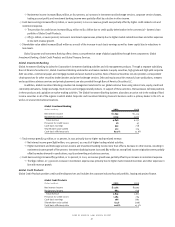
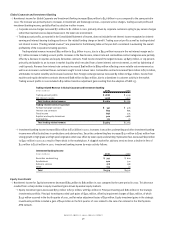
Global Credit Products
Global Credit Products provides credit and lending services and includes the corporate industry-focused portfolio, leasing and project finance.
Global Credit Products
(Dollars in millions)
2001 2000
Net interest income $2,181 $1,993
Noninterest income 664 678
Total revenue 2,845 2,671
Provision for credit losses 1,265 764
Cash basis earnings 766 887
Shareholder value added (127) (208)
Cash basis efficiency ratio 20.6% 23.5%