Bank of America 2001 Annual Report Download - page 36
Download and view the complete annual report
Please find page 36 of the 2001 Bank of America annual report below. You can navigate through the pages in the report by either clicking on the pages listed below, or by using the keyword search tool below to find specific information within the annual report.-
 1
1 -
2
-
3
-
4
-
5
-
6
-
7
-
8
-
9
-
10
-
11
-
12
-
13
-
14
-
15
-
16
-
17
-
18
-
19
-
20
-
21
-
22
-
23
-
24
-
25
-
 26
26 -
 27
27 -
 28
28 -
 29
29 -
 30
30 -
 31
31 -
 32
32 -
 33
33 -
 34
34 -
 35
35 -
 36
36 -
 37
37 -
 38
38 -
 39
39 -
 40
40 -
 41
41 -
 42
42 -
 43
43 -
 44
44 -
 45
45 -
 46
46 -
47
-
48
-
49
-
50
-
51
-
52
-
53
-
54
-
55
-
56
-
57
-
58
-
59
-
60
-
61
-
62
-
63
-
64
-
65
-
66
-
67
-
68
-
69
-
70
-
71
-
72
-
73
-
74
-
75
-
76
-
77
-
78
-
79
-
80
-
81
-
82
-
83
-
84
-
85
-
86
-
87
-
88
-
89
-
90
-
91
-
92
-
93
-
94
-
95
-
96
-
97
-
98
-
99
-
100
-
101
-
102
-
103
-
104
-
105
-
106
-
107
-
108
-
109
-
110
-
111
-
112
-
113
-
114
-
115
-
116
-
117
-
118
-
119
-
120
-
121
-
122
-
123
-
124
 |
 |

BANK OF AMERICA 2001 ANNUAL REPORT
34
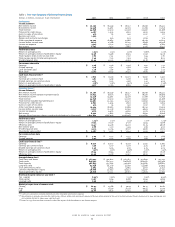
>Total revenue includes net interest income on a taxable-equivalent basis and noninterest income. Total revenue was $35.0 billion, an increase
of $1.7 billion.
>
Net interest income increased $2.0 billion to $20.6 billion. The increase was primarily due to the effects of changes in interest rates on the
Corporation’s asset and liability positions and investment portfolio repositioning, an increased trading-related contribution, higher deposit
and equity levels and a favorable shift in loan mix. These factors were partially offset by the impact of the money market deposit pricing
initiative and a decrease in auto lease financing contributions. Average managed loans and leases were $378.7 billion, a $1.2 billion decrease,
primarily due to an eight percent decrease in commercial loans and leases, partially offset by an eight percent increase in consumer loans
and leases. Average customer-based deposits grew to $306.9 billion, a $14.9 billion increase. The net interest yield was 3.68 percent,
a 48 basis point increase. The increase in the net interest yield was primarily due to the effect of changes in interest rates and investment
portfolio repositioning.
>
Noninterest income was $14.3 billion, a $234 million decrease. Consumer and Commercial Banking experienced a $321 million, or nine percent,
increase in service charges driven by higher business volumes. A $192 million, or nine percent, increase in card income was primarily due to
both new account growth in both credit and debit card and increased purchase volume on existing accounts. Revenue in the mortgage banking
business increased 48 percent primarily reflecting higher origination activity, increased gains from higher loan sales to the secondary market
and the favorable mark-to-market adjustments on certain mortgage banking assets and related derivative instruments, partially offset by
increased prepayments on mortgage loans as a result of the declining interest rate environment. Income from investment and brokerage
services increased $45 million in the Asset Management segment largely due to new asset management business and the completed acquisition
of Marsico Capital Management LLC (Marsico), partially offset by lower broker activity due to decreased trade volume. The noninterest income
component of trading-related revenue within Global Corporate and Investment Banking increased $77 million, as increased revenues from
trading-related activities in interest rate, fixed income and commodities contracts more than offset a decrease in equities and equity derivatives
trading. Investment banking income increased $67 million, as strong growth in fixed income origination was partially offset by weaker demand
for syndications, equity underwriting and advisory services. Equity Investments had equity investment gains of $230 million, reflecting a
sharp decline of $763 million.
>On August 15, 2001, the Corporation announced that it was exiting its auto leasing and subprime real estate lending businesses. As a result of
exiting these consumer finance businesses, the Corporation recorded pre-tax charges of $1.7 billion ($1.3 billion after-tax), consisting of provision
for credit losses of $395 million and business exit costs, the noninterest expense component, of $1.3 billion.
>Including the exit charge, the provision for credit losses was $4.3 billion. Excluding the exit charge, the provision for credit losses was $3.9 billion,
an increase of $1.4 billion from 2000. Excluding exit-related charge-offs of $635 million, net charge-offs were $3.6 billion, or 0.99 percent of average
loans and leases, an increase of 38 basis points from 2000. This increase in net charge-offs of $1.2 billion from 2000 was primarily due to credit
quality deterioration in the commercial – domestic portfolio and an increase in bankcard charge-offs. As a matter of corporate practice, we do not
discuss specific client relationships; however, due to the publicity and interest surrounding Enron Corporation, the Corporation is making an
exception. Net charge-offs in 2001 included $210 million related to Enron Corporation. Excluding exit-related charges, the Corporation recorded
additional provision expense in excess of charge-offs of $283 million due to deterioration in credit quality and the overall uncertainty in the economy.
>Nonperforming assets were $4.9 billion, or 1.49 percent of loans, leases and foreclosed properties at December 31, 2001, a $549 million decrease
from December 31, 2000. The decrease was primarily a result of the transfer of $1.2 billion of nonperforming subprime real estate loans to loans
held for sale as well as nonperforming loan sales, partially offset by increases in the commercial – domestic loan portfolio that resulted from credit
deterioration as companies were affected by the weakening economic environment. The allowance for credit losses totaled $6.9 billion or 2.09
percent of total loans and leases at December 31, 2001, a 35 basis point increase from 1.74 percent of total loans and leases at December 31, 2000.
>Noninterest expense excluding business exit costs in 2001 and restructuring charges in 2000 was $19.4 billion, a $1.3 billion increase, primarily
driven by higher personnel, litigation, professional fees, data processing and marketing expenses. Higher personnel expense was driven by a
$150 million severance charge in the fourth quarter of 2001 related to ongoing efficiency improvement programs, higher revenue-related incentive
compensation and increased salaries expense. Higher professional fees reflected the increase in initiatives related to the Corporation’s strategy to
improve customer satisfaction, the launch of a company-wide Six Sigma quality and productivity program and implementation of a new integrated
business planning process. The Corporation recorded $334 million in litigation expense in the fourth quarter of 2001 related to small settlements
and an addition to the legal reserve to cover increased exposure to existing litigation. Subsequent to December 31, 2001, the Corporation announced
that it had reached an agreement in principle to settle various shareholder lawsuits for payments totaling $490 million. The proposed settlement
will be paid from existing litigation reserves and insurance and will not have an impact on the Corporation’s financial results. For additional information
on litigation, see Note Twelve of the consolidated financial statements.
>A tax benefit of $418 million, generated as a result of the Corporation’s realignment of certain problem loan management activities into a wholly-
owned subsidiary, Banc of America Strategic Solutions, Inc. (SSI), resulted in a 17 percent effective tax rate for the fourth quarter of 2001. The
assets and liabilities of SSI are fully consolidated with those of the Corporation.