Bank of America 2001 Annual Report Download - page 52
Download and view the complete annual report
Please find page 52 of the 2001 Bank of America annual report below. You can navigate through the pages in the report by either clicking on the pages listed below, or by using the keyword search tool below to find specific information within the annual report.-
 1
1 -
2
-
3
-
4
-
5
-
6
-
7
-
8
-
9
-
10
-
11
-
12
-
13
-
14
-
15
-
16
-
17
-
18
-
19
-
20
-
21
-
22
-
23
-
24
-
25
-
26
-
27
-
28
-
29
-
30
-
31
-
32
-
33
-
34
-
35
-
36
-
37
-
38
-
39
-
40
-
41
-
 42
42 -
 43
43 -
 44
44 -
 45
45 -
 46
46 -
 47
47 -
 48
48 -
 49
49 -
 50
50 -
 51
51 -
 52
52 -
 53
53 -
 54
54 -
 55
55 -
 56
56 -
 57
57 -
 58
58 -
 59
59 -
 60
60 -
 61
61 -
 62
62 -
63
-
64
-
65
-
66
-
67
-
68
-
69
-
70
-
71
-
72
-
73
-
74
-
75
-
76
-
77
-
78
-
79
-
80
-
81
-
82
-
83
-
84
-
85
-
86
-
87
-
88
-
89
-
90
-
91
-
92
-
93
-
94
-
95
-
96
-
97
-
98
-
99
-
100
-
101
-
102
-
103
-
104
-
105
-
106
-
107
-
108
-
109
-
110
-
111
-
112
-
113
-
114
-
115
-
116
-
117
-
118
-
119
-
120
-
121
-
122
-
123
-
124
 |
 |

BANK OF AMERICA 2001 ANNUAL REPORT
50
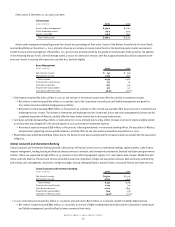
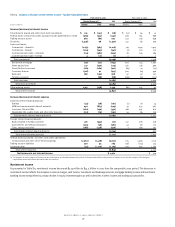
>On August 15, 2001, the Corporation announced that it was exiting its auto leasing and subprime real estate lending businesses. As a result of
this strategic decision, the Corporation recorded pre-tax business exit costs in the third quarter of 2001 of $1.3 billion in noninterest expense.
Business exit costs consisted of goodwill write-offs of $685 million, auto lease residual charges of $400 million, real estate servicing asset
charges of $145 million and other transaction costs of $75 million.
>As part of its productivity and investment initiatives announced on July 28, 2000, the Corporation recorded a pre-tax charge of $550 million in the
third quarter of 2000. Of the $550 million restructuring charge, approximately $475 million was used to cover severance and related costs and
approximately $75 million was used for other costs related to process change and channel consolidation. At December 31, 2001, the reserve had
been substantially utilized.
Income Taxes
The Corporation’s income tax expense for 2001 was $3.3 billion for an effective tax rate of 32.9 percent and for 2000 was $4.3 billion for an
effective tax rate of 36.2 percent. The decrease in the effective tax rate for 2001 was due primarily to a fourth quarter tax benefit of $418 million. The
tax benefit, which resulted in a 17 percent effective tax rate for the fourth quarter of 2001, was generated as a result of the Corporation’s realignment
of certain problem loan management activities into a wholly-owned subsidiary. This tax benefit was partially offset by the portion of goodwill write-off
included in business exit costs recorded during 2001 that is not deductible for federal or state income tax purposes. Note Seventeen of the consolidated
financial statements includes a reconciliation of expected federal income tax expense computed using the federal statutory rate of 35 percent to actual
income tax expense.
Balance Sheet Review
The Corporation utilizes an integrated approach in managing its balance sheet. The following summary discusses various aspects of both on- and
off-balance sheet positions as of December 31, 2001 and 2000 and for the years then ended.
Cash and Cash Equivalents
At December 31, 2001, cash and cash equivalents were $26.8 billion, a decrease of $676 million from December 31, 2000. During 2001, net cash used
in operating activities was $12.8 billion, net cash provided by investing activities was $37.6 billion and net cash used in financing activities was
$25.3 billion. For further information on cash flows, see the Consolidated Statement of Cash Flows of the consolidated financial statements.
Securities
The securities portfolio serves a primary role in the Corporation’s balance sheet management activities. The decision to purchase or sell securities is
based upon the current assessment of economic and financial conditions, including the interest rate environment, liquidity requirements and on- and
off-balance sheet positions.
The average securities portfolio in 2001 decreased $23.8 billion to $60.4 billion due to significant reductions in the portfolio in early 2001. As a
percentage of total uses of funds, the average securities portfolio decreased by four percent to nine percent in 2001.
The securities portfolio at December 31, 2001 consisted of available-for-sale securities totaling $84.5 billion compared to $64.7 billion at
December 31, 2000. The increase in available-for-sale securities was concentrated in the mortgage-backed securities portfolio and was primarily a
result of loans securitized during the year and subsequently held in the portfolio. The reduction in the U.S. Treasury securities and agency debentures
in the available-for-sale portfolio was driven by portfolio repositioning during the year. The estimated average duration of the available-for-sale securities
portfolio was 3.34 years at December 31, 2001 compared to 4.13 years at December 31, 2000.
The valuation allowance for available-for-sale and marketable equity securities is included in shareholders’ equity. At December 31, 2001, the
valuation allowance consisted of net unrealized losses of $480 million, net of related income taxes of $311 million. At December 31, 2000, the valuation
allowance reflected net unrealized losses of $560 million, net of related income taxes of $330 million.
Held-to-maturity securities totaled $1.0 billion at December 31, 2001 compared to $1.2 billion at December 31, 2000. At December 31, 2001 and
2000, the market value of the Corporation’s held-to-maturity securities reflected pre-tax net unrealized losses of $40 million and $54 million, respectively.
Gains on sales of securities were $475 million in 2001 compared to $25 million in 2000. The majority of the gains were realized in the fourth
quarter of 2001 as the Corporation reduced its risk of slower prepayments in the securities portfolio through sales of mortgage-backed securities in
anticipation of rising interest rates. See Note Three of the consolidated financial statements for further details on securities.
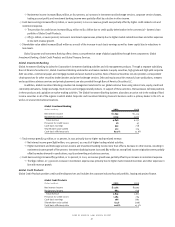
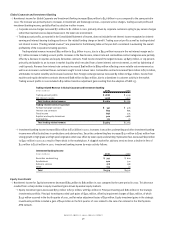
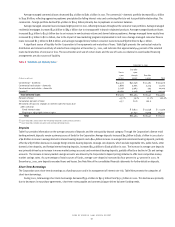
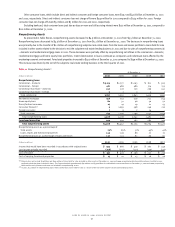
Loans and Leases
As presented in Table Four, average loans and leases, the Corporation’s primary use of funds, decreased $27.2 billion to $365.4 billion in 2001. This
decline was primarily due to a decrease in consumer finance loans as the Corporation exited the subprime real estate lending business and a decline
in commercial loans as the Corporation continued efforts to reduce corporate loan levels and exit less profitable relationships. The Corporation also
reviews loans on a managed basis, which adjusts for securitizations, sales and divestitures. Average managed loans and leases decreased $1.2 billion
to $378.7 billion in 2001. This decrease was primarily due to lower average managed commercial loan levels, partially offset by growth in average
managed consumer loans. See Note Eight of the consolidated financial statements for additional information on managed loans.