Bank of America 2001 Annual Report Download - page 45
Download and view the complete annual report
Please find page 45 of the 2001 Bank of America annual report below. You can navigate through the pages in the report by either clicking on the pages listed below, or by using the keyword search tool below to find specific information within the annual report.-
 1
1 -
2
-
3
-
4
-
5
-
6
-
7
-
8
-
9
-
10
-
11
-
12
-
13
-
14
-
15
-
16
-
17
-
18
-
19
-
20
-
21
-
22
-
23
-
24
-
25
-
26
-
27
-
28
-
29
-
30
-
31
-
32
-
33
-
34
-
 35
35 -
 36
36 -
 37
37 -
 38
38 -
 39
39 -
 40
40 -
 41
41 -
 42
42 -
 43
43 -
 44
44 -
 45
45 -
 46
46 -
 47
47 -
 48
48 -
 49
49 -
 50
50 -
 51
51 -
 52
52 -
 53
53 -
 54
54 -
 55
55 -
56
-
57
-
58
-
59
-
60
-
61
-
62
-
63
-
64
-
65
-
66
-
67
-
68
-
69
-
70
-
71
-
72
-
73
-
74
-
75
-
76
-
77
-
78
-
79
-
80
-
81
-
82
-
83
-
84
-
85
-
86
-
87
-
88
-
89
-
90
-
91
-
92
-
93
-
94
-
95
-
96
-
97
-
98
-
99
-
100
-
101
-
102
-
103
-
104
-
105
-
106
-
107
-
108
-
109
-
110
-
111
-
112
-
113
-
114
-
115
-
116
-
117
-
118
-
119
-
120
-
121
-
122
-
123
-
124
 |
 |

BANK OF AMERICA 2001 ANNUAL REPORT
43
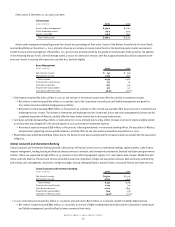
>Shareholder value added declined $604 million reflecting the decline in cash basis earnings and an increase in capital driven by an increase in
the level of equity investments and unused commitments.
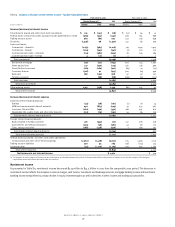
Results of Operations
Net Interest Income
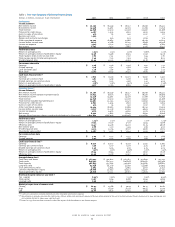
An analysis of the Corporation’s net interest income on a taxable-equivalent basis and average balance sheet for the last three years and most recent
five quarters is presented in Tables Four and Twenty-Six, respectively. The changes in net interest income from year to year are analyzed in Table Five.
As reported, net interest income on a taxable-equivalent basis increased $2.0 billion to $20.6 billion in 2001 compared to 2000. Management
also reviews “core net interest income,” which adjusts reported net interest income for the impact of trading-related activities, securitizations, asset
sales and divestitures, excluding balance sheet portfolios used to manage interest rate risk. For purposes of internal analysis, management combines
trading-related net interest income with trading account profits, as discussed in the “Noninterest Income” section on page 46, as trading strategies
are typically evaluated based on total revenue. Noninterest income, rather than net interest income, is recorded for assets that have been securitized
as the Corporation takes on the role of servicer and records servicing income, and gains and losses on securitizations, where appropriate.
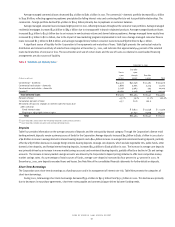
Table Three below provides a reconciliation of net interest income on a taxable-equivalent basis presented in Table Four to core net interest income
for the year ended December 31:
Table 3 Net Interest Income
(Dollars in millions)
2001 2000 Change
Net interest income
As reported(1) $ 20,633 $ 18,671 10.5%
Less: Trading-related net interest income (1,566) (1,023)
Add: Impact of securitizations, asset sales and divestitures 65 7
Core net interest income $19,132 $ 17,655 8.4%
Average earning assets
As reported $ 560,316 $583,467 (4.0)%
Less: Trading-related earning assets (125,263) (113,551)
Add: Earning assets securitized, sold and divested 3,616 641
Core average earning assets $438,669 $470,557 (6.8)%
Net interest yield on earning assets(1,2)
As reported 3.68% 3.20% 48bp
Add: Impact of trading-related activities 0.69 0.55 14
Impact of securitizations, asset sales and divestitures (0.01) –(1)
Core net interest yield on earning assets 4.36% 3.75% 61bp
(1) Net interest income is presented on a taxable-equivalent basis.
(2) bp denotes basis points; 100 bp equals 1%.
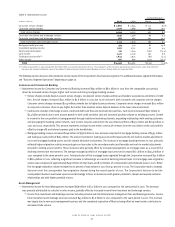
Core net interest income on a taxable-equivalent basis was $19.1 billion in 2001 compared to $17.7 billion in 2000, an increase of $1.5 billion. The
increase in core net interest income was driven by changes in interest rates and the effect of portfolio repositioning, higher levels of core funding and
a favorable change in managed loan mix, partially offset by the impact of the money market deposit pricing initiative and the decrease in auto lease
financing contributions. The higher levels of core funding reflected a $14.9 billion increase in average customer-based deposits and a $1.5 billion
increase in average shareholders’ equity.
Core average earning assets were $438.7 billion in 2001, a decrease of $31.9 billion, compared to $470.6 billion in 2000, primarily reflecting
reduced securities levels and average managed commercial loan balances partially offset by growth in average managed consumer loan levels. Falling
interest rates in 2001 allowed the Corporation to shed lower yielding assets and reposition its balance sheet to take advantage of a steepened yield
curve. Average managed consumer loans increased eight percent led by growth in residential mortgages, bankcard receivables and home equity
lines. Average managed commercial loans decreased eight percent, reflecting continuing efforts to reduce corporate loan levels and exit less profitable
relationships. Loan growth is dependent on economic conditions and the management of borrower, industry, product and geographic concentrations.
The core net interest yield increased 61 basis points to 4.36 percent in 2001 compared to 3.75 percent in 2000, mainly due to the effects of changes
in interest rates and portfolio repositioning, higher levels of core funding and a favorable change in managed loan mix.