Bank of America 2001 Annual Report Download - page 121
Download and view the complete annual report
Please find page 121 of the 2001 Bank of America annual report below. You can navigate through the pages in the report by either clicking on the pages listed below, or by using the keyword search tool below to find specific information within the annual report.-
 1
1 -
2
-
3
-
4
-
5
-
6
-
7
-
8
-
9
-
10
-
11
-
12
-
13
-
14
-
15
-
16
-
17
-
18
-
19
-
20
-
21
-
22
-
23
-
24
-
25
-
26
-
27
-
28
-
29
-
30
-
31
-
32
-
33
-
34
-
35
-
36
-
37
-
38
-
39
-
40
-
41
-
42
-
43
-
44
-
45
-
46
-
47
-
48
-
49
-
50
-
51
-
52
-
53
-
54
-
55
-
56
-
57
-
58
-
59
-
60
-
61
-
62
-
63
-
64
-
65
-
66
-
67
-
68
-
69
-
70
-
71
-
72
-
73
-
74
-
75
-
76
-
77
-
78
-
79
-
80
-
81
-
82
-
83
-
84
-
85
-
86
-
87
-
88
-
89
-
90
-
91
-
92
-
93
-
94
-
95
-
96
-
97
-
98
-
99
-
100
-
101
-
102
-
103
-
104
-
105
-
106
-
107
-
108
-
109
-
110
-
 111
111 -
 112
112 -
 113
113 -
 114
114 -
 115
115 -
 116
116 -
 117
117 -
 118
118 -
 119
119 -
 120
120 -
 121
121 -
 122
122 -
 123
123 -
 124
124
 |
 |

BANK OF AMERICA 2001 ANNUAL REPORT
119
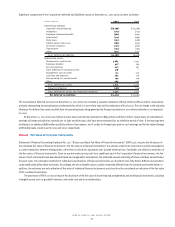
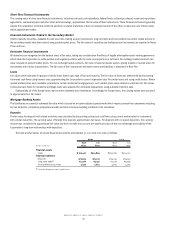
Note 21 Performance by Geographic Area
Since the Corporation’s operations are highly integrated, certain asset, liability, income and expense amounts must be allocated to arrive at total assets,
total revenue, income (loss) before income taxes and net income (loss) by geographic area. The Corporation identifies its geographic performance based
upon the business unit structure used to manage the capital or expense deployed in the region as applicable. This requires certain judgements related
to the allocation of revenue so that revenue can be appropriately matched with the related expense or capital deployed in the region. Translation gains,
for those units in hyperinflationary economies, net of hedging, totaled $2 million in 2001 compared to translation losses of $1 million in 2000 and trans-
lation gains of $4 million in 1999. These amounts, which are reported in other noninterest income, are included in the table below:
Total revenue
(2)
Total assets
(1)
for the year ended Income (loss)
(Dollars in millions)
Year at December 31 December 31 before income taxes Net income (loss)
Domestic(3) 2001 $570,184 $32,187 $9,428 $6,315
2000 587,287 30,633 10,584 6,693
1999 30,038 11,164 7,159
Asia 2001 17,231 921 411 276
2000 22,093 954 508 355
1999 1,104 535 367
Europe, Middle East and Africa 2001 27,674 1,227 435 295
2000 25,799 995 533 363
1999 693 247 177
Latin America and the Caribbean 2001 6,675 303 (157) (94)
2000 7,012 349 163 106
1999 471 269 179
Tot al Foreign 2001 51,580 2,451 689 477
2000 54,904 2,298 1,204 824
1999 2,268 1,051 723
Total Consolidated 2001 $621,764 $34,638 $10,117 $6,792
2000 642,191 32,931 11,788 7,517
1999 32,306 12,215 7,882
(1) Total assets includes long-lived assets, which are primarily located in the U.S.
(2) There were no material intercompany revenues between geographic regions for any of the periods presented.
(3) Includes the Corporation’s Canadian operations, which had total assets of $2,849 and $3,938; total revenues of $121, $118 and $100; income before
income taxes of $4, $34 and $55; and net income of $0.3, $22 and $30 at and for the years ended December 31, 2001, 2000 and 1999, respectively.